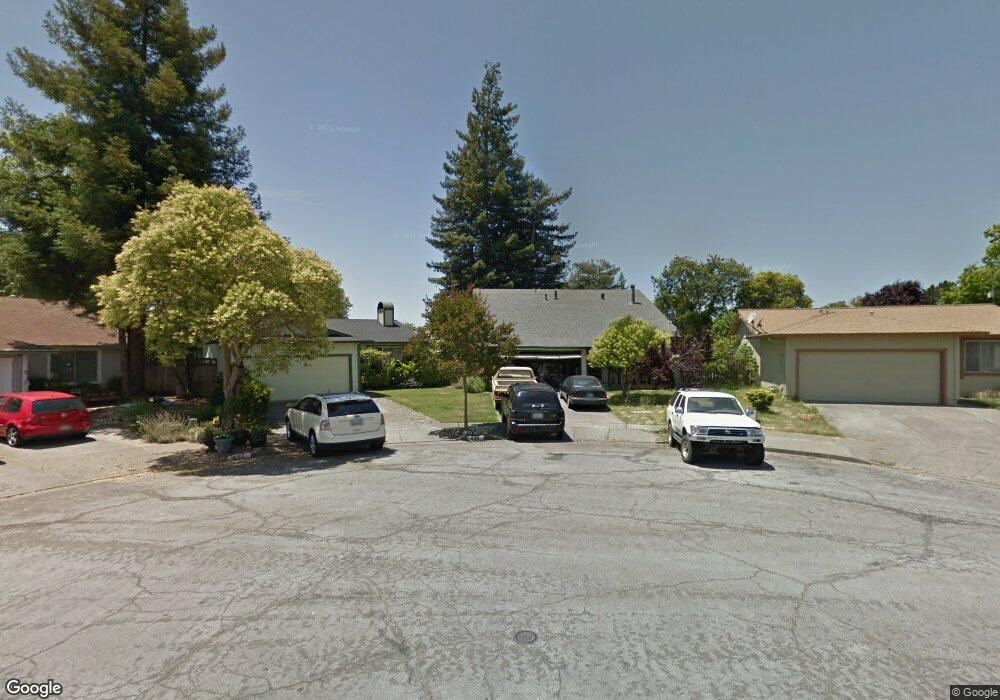
413 Saint Mary Place Santa Rosa, CA 95409
Estimated Value: $615,879 - $720,000
4
Beds
2
Baths
1,364
Sq Ft
$491/Sq Ft
Est. Value
About This Home
This home is located at 413 Saint Mary Place, Santa Rosa, CA 95409 and is currently estimated at $669,220, approximately $490 per square foot. 413 Saint Mary Place is a home located in Sonoma County with nearby schools including Rincon Valley Middle School, Maria Carrillo High School, and Binkley Elementary Charter School.
Ownership History
Date
Name
Owned For
Owner Type
Purchase Details
Closed on
Jan 11, 2018
Sold by
Mahlsted John and Mahlstedt Patti K
Bought by
Mashlstedt John D and Mashlstedt Trust
Current Estimated Value
Purchase Details
Closed on
Dec 9, 2015
Sold by
Keane Edward
Bought by
Mahlstedt John and Mahlstedt Patti K
Home Financials for this Owner
Home Financials are based on the most recent Mortgage that was taken out on this home.
Original Mortgage
$359,200
Outstanding Balance
$282,540
Interest Rate
3.71%
Mortgage Type
New Conventional
Estimated Equity
$386,680
Purchase Details
Closed on
Nov 13, 2000
Sold by
Glow Garold F and Glow Cynthia A
Bought by
Keane Edward
Home Financials for this Owner
Home Financials are based on the most recent Mortgage that was taken out on this home.
Original Mortgage
$226,800
Interest Rate
8.89%
Purchase Details
Closed on
Apr 10, 1998
Sold by
Benedetti Aloha
Bought by
Clow Garold F and Clow Cynthia A
Home Financials for this Owner
Home Financials are based on the most recent Mortgage that was taken out on this home.
Original Mortgage
$148,000
Interest Rate
7.18%
Create a Home Valuation Report for This Property
The Home Valuation Report is an in-depth analysis detailing your home's value as well as a comparison with similar homes in the area
Home Values in the Area
Average Home Value in this Area
Purchase History
| Date | Buyer | Sale Price | Title Company |
|---|---|---|---|
| Mashlstedt John D | -- | None Available | |
| Mahlstedt John | $449,000 | First American Title Company | |
| Keane Edward | $283,500 | Fidelity National Title Co | |
| Clow Garold F | $71,500 | North Bay Title Company |
Source: Public Records
Mortgage History
| Date | Status | Borrower | Loan Amount |
|---|---|---|---|
| Open | Mahlstedt John | $359,200 | |
| Previous Owner | Keane Edward | $226,800 | |
| Previous Owner | Clow Garold F | $148,000 |
Source: Public Records
Tax History Compared to Growth
Tax History
| Year | Tax Paid | Tax Assessment Tax Assessment Total Assessment is a certain percentage of the fair market value that is determined by local assessors to be the total taxable value of land and additions on the property. | Land | Improvement |
|---|---|---|---|---|
| 2025 | $6,114 | $531,515 | $212,487 | $319,028 |
| 2024 | $6,114 | $521,094 | $208,321 | $312,773 |
| 2023 | $6,114 | $510,878 | $204,237 | $306,641 |
| 2022 | $5,645 | $500,862 | $200,233 | $300,629 |
| 2021 | $5,532 | $491,042 | $196,307 | $294,735 |
| 2020 | $5,512 | $486,008 | $194,295 | $291,713 |
| 2019 | $5,460 | $476,480 | $190,486 | $285,994 |
| 2018 | $5,427 | $467,138 | $186,751 | $280,387 |
| 2017 | $5,327 | $457,980 | $183,090 | $274,890 |
| 2016 | $5,352 | $449,000 | $179,500 | $269,500 |
| 2015 | $4,195 | $355,445 | $125,376 | $230,069 |
| 2014 | $4,044 | $348,484 | $122,921 | $225,563 |
Source: Public Records
Map
Nearby Homes
- 311 Algiers Ct
- 5015 Charmian Dr
- 537 Emerald Park Ct
- 305 Simone Place N
- 61 Coronado Cir
- 66 Coronado Cir
- 164 Brookview Ct
- 103 Glenoak Ct
- 5020 Roma St
- 5086 Charmian Dr
- 29 Coronado Cir
- 71 Oakcreek Ct
- 52 Oakstone Ct Unit 52
- 5209 San Luis Ave
- 48 Shadyleaf Ct
- 31 Springhill Ct
- 28 Springhill Ct
- 206 Indian Creek Dr
- 4705 Culebra Way
- 16 Redwood Ct Unit 55
- 417 Saint Mary Place
- 409 Saint Mary Place
- 428 Tanglewood Ct
- 432 Tanglewood Ct
- 421 Saint Mary Place
- 424 Tanglewood Ct
- 405 Saint Mary Place
- 436 Tanglewood Ct
- 425 Saint Mary Place
- 440 Tanglewood Ct
- 401 Saint Mary Place
- 412 Saint Mary Place
- 418 Saint Mary Place
- 429 Saint Mary Place
- 400 Saint Mary Place
- 420 Tanglewood Ct
- 444 Tanglewood Ct
- 422 Saint Mary Place
- 426 Saint Mary Place
- 429 Tanglewood Ct