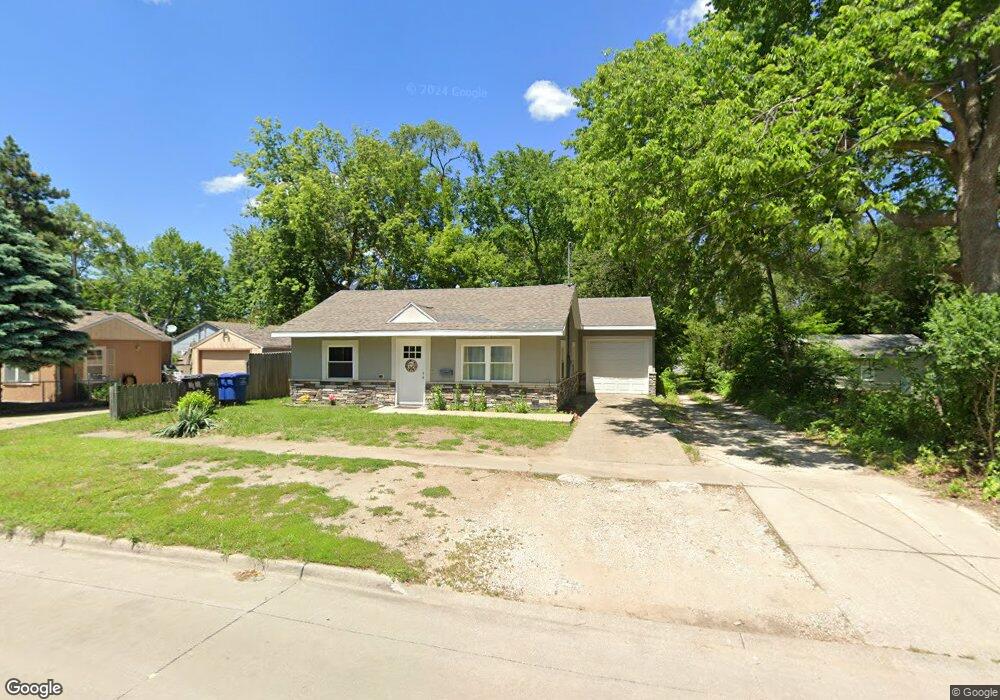
413 Shawnee Ave Des Moines, IA 50313
Highland Park NeighborhoodEstimated Value: $170,657 - $189,000
3
Beds
1
Bath
1,157
Sq Ft
$155/Sq Ft
Est. Value
About This Home
This home is located at 413 Shawnee Ave, Des Moines, IA 50313 and is currently estimated at $179,414, approximately $155 per square foot. 413 Shawnee Ave is a home located in Polk County with nearby schools including Oak Park Elementary School, Harding Middle School, and North High School.
Ownership History
Date
Name
Owned For
Owner Type
Purchase Details
Closed on
Aug 24, 2020
Sold by
Vanmeer Debra and Devan Meer De
Bought by
Banda Ranulfo and Banda Ranulfo C
Current Estimated Value
Purchase Details
Closed on
May 24, 2016
Sold by
Leff Enterprises Llc
Bought by
Banda Ranulfo
Purchase Details
Closed on
Apr 13, 2016
Sold by
Tsc 35 Llc
Bought by
Leff Enterprises Llc
Purchase Details
Closed on
Apr 24, 2012
Sold by
Pinegar William F and Pinegar Mary J
Bought by
Coffey Robert
Create a Home Valuation Report for This Property
The Home Valuation Report is an in-depth analysis detailing your home's value as well as a comparison with similar homes in the area
Home Values in the Area
Average Home Value in this Area
Purchase History
| Date | Buyer | Sale Price | Title Company |
|---|---|---|---|
| Banda Ranulfo | -- | None Available | |
| Banda Ranulfo C | -- | None Listed On Document | |
| Banda Ranulfo | $5,500 | None Available | |
| Leff Enterprises Llc | -- | None Available | |
| Coffey Robert | -- | None Available |
Source: Public Records
Tax History Compared to Growth
Tax History
| Year | Tax Paid | Tax Assessment Tax Assessment Total Assessment is a certain percentage of the fair market value that is determined by local assessors to be the total taxable value of land and additions on the property. | Land | Improvement |
|---|---|---|---|---|
| 2025 | $2,860 | $164,700 | $21,900 | $142,800 |
| 2024 | $2,860 | $145,400 | $19,000 | $126,400 |
| 2023 | $2,888 | $145,400 | $19,000 | $126,400 |
| 2022 | $2,866 | $122,500 | $16,500 | $106,000 |
| 2021 | $2,686 | $122,500 | $16,500 | $106,000 |
| 2020 | $2,790 | $107,600 | $14,400 | $93,200 |
| 2019 | $1,058 | $107,600 | $14,400 | $93,200 |
| 2018 | $1,113 | $32,500 | $12,500 | $20,000 |
| 2017 | $1,379 | $32,500 | $12,500 | $20,000 |
| 2016 | $2,925 | $47,400 | $11,200 | $36,200 |
| 2015 | $1,250 | $47,400 | $11,200 | $36,200 |
| 2014 | $2,638 | $47,900 | $11,000 | $36,900 |
Source: Public Records
Map
Nearby Homes