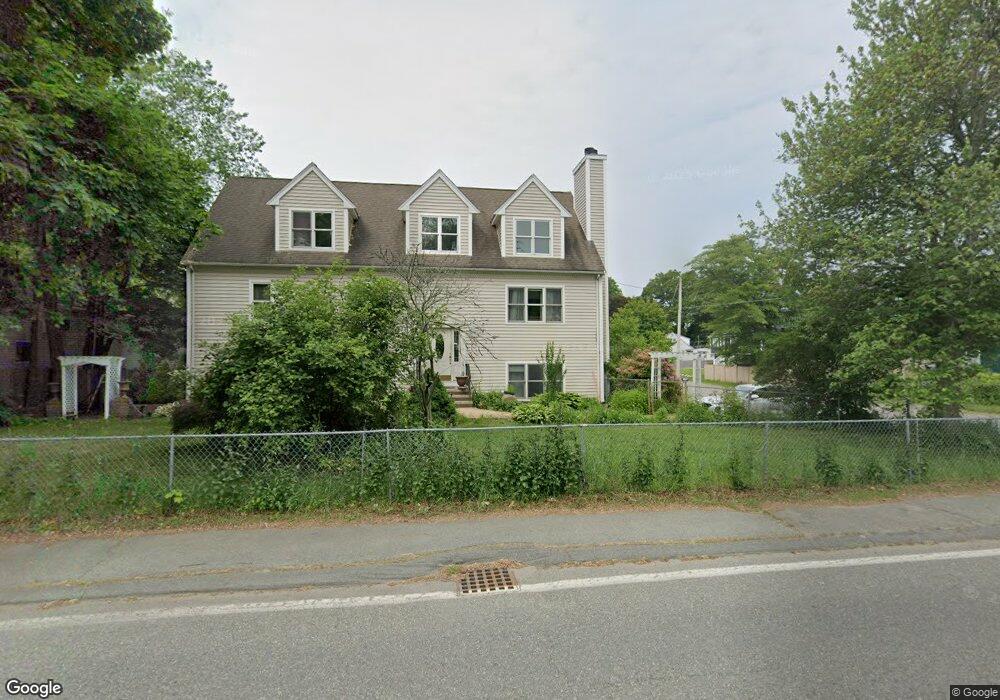
413 Summer St Brockton, MA 02302
Campello NeighborhoodEstimated Value: $717,401 - $866,000
5
Beds
3
Baths
3,700
Sq Ft
$216/Sq Ft
Est. Value
About This Home
This home is located at 413 Summer St, Brockton, MA 02302 and is currently estimated at $798,350, approximately $215 per square foot. 413 Summer St is a home located in Plymouth County with nearby schools including Gilmore Elementary School, Davis K-8 School, and John F. Kennedy Elementary School.
Ownership History
Date
Name
Owned For
Owner Type
Purchase Details
Closed on
Oct 26, 2012
Sold by
Boyer Daniel E and Filho Antonio N
Bought by
Boyer Daniel E and Naseimento Izadora
Current Estimated Value
Purchase Details
Closed on
Oct 21, 2009
Sold by
413 Summer Street Nt
Bought by
Boyer Daniel E and Filho Antonio Nascime
Home Financials for this Owner
Home Financials are based on the most recent Mortgage that was taken out on this home.
Original Mortgage
$240,000
Interest Rate
5.09%
Mortgage Type
Purchase Money Mortgage
Purchase Details
Closed on
Dec 8, 2006
Sold by
Boyer Joey and Boyer Daniel K
Bought by
Boyer Tr Joey and Boyer Daniel E
Purchase Details
Closed on
May 21, 2003
Sold by
Boyer Joey
Bought by
Boyer Joey and Boyer Daniel E
Home Financials for this Owner
Home Financials are based on the most recent Mortgage that was taken out on this home.
Original Mortgage
$200,000
Interest Rate
5.86%
Mortgage Type
Purchase Money Mortgage
Create a Home Valuation Report for This Property
The Home Valuation Report is an in-depth analysis detailing your home's value as well as a comparison with similar homes in the area
Home Values in the Area
Average Home Value in this Area
Purchase History
| Date | Buyer | Sale Price | Title Company |
|---|---|---|---|
| Boyer Daniel E | -- | -- | |
| Boyer Daniel E | -- | -- | |
| Boyer Tr Joey | -- | -- | |
| Boyer Joey | -- | -- |
Source: Public Records
Mortgage History
| Date | Status | Borrower | Loan Amount |
|---|---|---|---|
| Previous Owner | Boyer Joey | $240,000 | |
| Previous Owner | Boyer Joey | $200,000 |
Source: Public Records
Tax History
| Year | Tax Paid | Tax Assessment Tax Assessment Total Assessment is a certain percentage of the fair market value that is determined by local assessors to be the total taxable value of land and additions on the property. | Land | Improvement |
|---|---|---|---|---|
| 2025 | $7,459 | $615,900 | $159,800 | $456,100 |
| 2024 | $7,379 | $613,900 | $159,800 | $454,100 |
| 2023 | $7,573 | $583,400 | $110,000 | $473,400 |
| 2022 | $7,368 | $527,400 | $100,000 | $427,400 |
| 2021 | $6,876 | $474,200 | $92,700 | $381,500 |
| 2020 | $6,587 | $434,800 | $81,400 | $353,400 |
| 2019 | $6,670 | $429,200 | $77,700 | $351,500 |
| 2018 | $6,191 | $385,500 | $77,700 | $307,800 |
| 2017 | $6,477 | $402,300 | $77,700 | $324,600 |
| 2016 | $6,355 | $366,100 | $74,100 | $292,000 |
| 2015 | $6,182 | $340,600 | $74,100 | $266,500 |
| 2014 | $6,057 | $334,100 | $74,100 | $260,000 |
Source: Public Records
Map
Nearby Homes
Your Personal Tour Guide
Ask me questions while you tour the home.