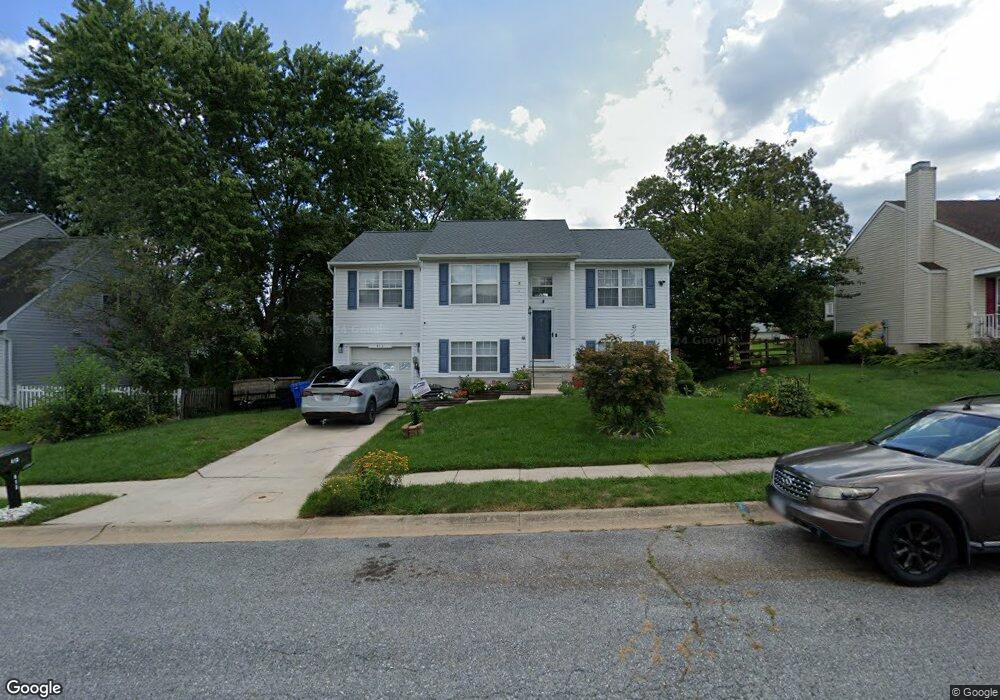
413 Taney Dr Taneytown, MD 21787
Estimated Value: $353,000 - $397,000
4
Beds
2
Baths
1,684
Sq Ft
$222/Sq Ft
Est. Value
About This Home
This home is located at 413 Taney Dr, Taneytown, MD 21787 and is currently estimated at $374,487, approximately $222 per square foot. 413 Taney Dr is a home located in Carroll County with nearby schools including Taneytown Elementary School, Northwest Middle School, and Francis Scott Key High School.
Ownership History
Date
Name
Owned For
Owner Type
Purchase Details
Closed on
Oct 20, 2008
Sold by
Weeks Jeffrey S
Bought by
Ndunda Charles N
Current Estimated Value
Home Financials for this Owner
Home Financials are based on the most recent Mortgage that was taken out on this home.
Original Mortgage
$250,398
Outstanding Balance
$164,976
Interest Rate
6.58%
Mortgage Type
FHA
Estimated Equity
$209,511
Purchase Details
Closed on
Aug 26, 2008
Sold by
Weeks Jeffrey S
Bought by
Ndunda Charles N
Home Financials for this Owner
Home Financials are based on the most recent Mortgage that was taken out on this home.
Original Mortgage
$250,398
Outstanding Balance
$164,976
Interest Rate
6.58%
Mortgage Type
FHA
Estimated Equity
$209,511
Purchase Details
Closed on
Feb 20, 2001
Sold by
Weeks Jeffrey S
Bought by
Weeks Jeffrey S and Weeks John W
Purchase Details
Closed on
Nov 28, 1995
Sold by
Petenbrink Paul James
Bought by
Duley Juanda E F
Create a Home Valuation Report for This Property
The Home Valuation Report is an in-depth analysis detailing your home's value as well as a comparison with similar homes in the area
Purchase History
| Date | Buyer | Sale Price | Title Company |
|---|---|---|---|
| Ndunda Charles N | $253,000 | -- | |
| Ndunda Charles N | $253,000 | -- | |
| Weeks Jeffrey S | -- | -- | |
| Weeks Jeffrey S | $134,500 | -- | |
| Duley Juanda E F | $113,875 | -- |
Source: Public Records
Mortgage History
| Date | Status | Borrower | Loan Amount |
|---|---|---|---|
| Open | Ndunda Charles N | $250,398 | |
| Previous Owner | Ndunda Charles N | $250,398 |
Source: Public Records
Tax History
| Year | Tax Paid | Tax Assessment Tax Assessment Total Assessment is a certain percentage of the fair market value that is determined by local assessors to be the total taxable value of land and additions on the property. | Land | Improvement |
|---|---|---|---|---|
| 2025 | $4,176 | $280,300 | $0 | $0 |
| 2024 | $3,887 | $260,900 | $0 | $0 |
| 2023 | $3,598 | $241,500 | $90,000 | $151,500 |
| 2022 | $3,463 | $232,433 | $0 | $0 |
| 2021 | $6,701 | $223,367 | $0 | $0 |
| 2020 | $3,214 | $214,300 | $80,000 | $134,300 |
| 2019 | $3,151 | $210,067 | $0 | $0 |
| 2018 | $3,067 | $205,833 | $0 | $0 |
| 2017 | $3,003 | $201,600 | $0 | $0 |
| 2016 | -- | $196,133 | $0 | $0 |
| 2015 | -- | $190,667 | $0 | $0 |
| 2014 | -- | $185,200 | $0 | $0 |
Source: Public Records
Map
Nearby Homes
Your Personal Tour Guide
Ask me questions while you tour the home.