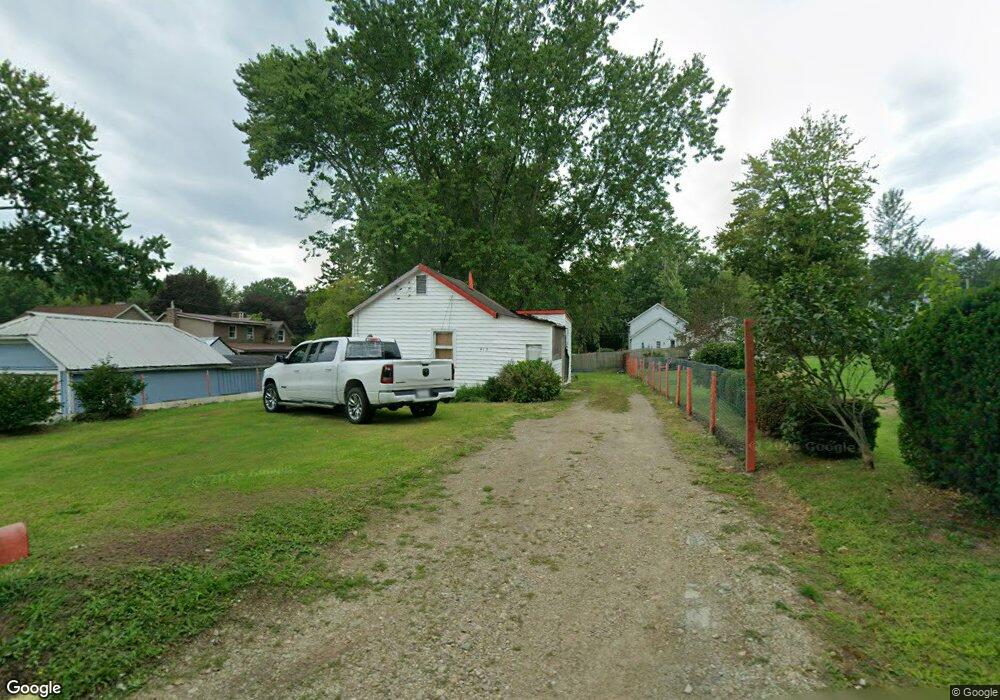
413 Viaduct St Conneaut, OH 44030
Estimated Value: $76,970 - $124,000
2
Beds
1
Bath
406
Sq Ft
$268/Sq Ft
Est. Value
About This Home
This home is located at 413 Viaduct St, Conneaut, OH 44030 and is currently estimated at $108,993, approximately $268 per square foot. 413 Viaduct St is a home with nearby schools including Lakeshore Primary Elementary School, Gateway Elementary School, and Conneaut Middle School.
Ownership History
Date
Name
Owned For
Owner Type
Purchase Details
Closed on
Aug 25, 2014
Sold by
Jones Keith and Jones Evelyn P
Bought by
Miranda Juan A Gonzalez
Current Estimated Value
Purchase Details
Closed on
Sep 14, 2009
Sold by
Jones Keith and Jones Evelyn
Bought by
Gonzalez Juan A
Home Financials for this Owner
Home Financials are based on the most recent Mortgage that was taken out on this home.
Original Mortgage
$25,000
Interest Rate
5.38%
Mortgage Type
Seller Take Back
Purchase Details
Closed on
Jan 25, 2005
Sold by
Hunt Gordon G and Hunt Gloria M
Bought by
Jones Keith and Jones Evelyn P
Purchase Details
Closed on
Nov 20, 1996
Sold by
Vincent Janice R
Bought by
Hunt Gordon G and Hunt Gloria M
Home Financials for this Owner
Home Financials are based on the most recent Mortgage that was taken out on this home.
Original Mortgage
$13,500
Interest Rate
7.94%
Mortgage Type
New Conventional
Create a Home Valuation Report for This Property
The Home Valuation Report is an in-depth analysis detailing your home's value as well as a comparison with similar homes in the area
Home Values in the Area
Average Home Value in this Area
Purchase History
| Date | Buyer | Sale Price | Title Company |
|---|---|---|---|
| Miranda Juan A Gonzalez | $25,000 | Ashtabula Land Title | |
| Gonzalez Juan A | $25,000 | Attorney | |
| Jones Keith | $11,500 | Ashtabula Land Title | |
| Hunt Gordon G | $13,500 | -- |
Source: Public Records
Mortgage History
| Date | Status | Borrower | Loan Amount |
|---|---|---|---|
| Previous Owner | Gonzalez Juan A | $25,000 | |
| Previous Owner | Hunt Gordon G | $13,500 |
Source: Public Records
Tax History
| Year | Tax Paid | Tax Assessment Tax Assessment Total Assessment is a certain percentage of the fair market value that is determined by local assessors to be the total taxable value of land and additions on the property. | Land | Improvement |
|---|---|---|---|---|
| 2024 | $817 | $11,170 | $2,770 | $8,400 |
| 2023 | $535 | $11,170 | $2,770 | $8,400 |
| 2022 | $481 | $8,830 | $2,140 | $6,690 |
| 2021 | $489 | $8,830 | $2,140 | $6,690 |
| 2020 | $489 | $8,830 | $2,140 | $6,690 |
| 2019 | $507 | $9,000 | $2,140 | $6,860 |
| 2018 | $484 | $9,000 | $2,140 | $6,860 |
| 2017 | $558 | $9,000 | $2,140 | $6,860 |
| 2016 | $629 | $7,850 | $1,860 | $5,990 |
| 2015 | $633 | $7,850 | $1,860 | $5,990 |
| 2014 | $589 | $7,850 | $1,860 | $5,990 |
| 2013 | $458 | $4,970 | $2,800 | $2,170 |
Source: Public Records
Map
Nearby Homes
- 366 Old Main Rd
- 0 Dorman Rd
- 284 Clay St
- 146 Nickle Plate Ave
- 276 Orange St
- 475 State St
- 386 Washington St
- 18 Hillcrest Ct
- 20 Hillcrest Ct
- 450 Buffalo St
- 297 Depot St
- 536 Madison St
- 630 Dorman Rd
- 238 Whitney St
- 434 E Main Rd
- 370 E Underridge Rd
- 805 Main St Unit 807
- 522 Shackson St
- VL Center Rd
- 716 Grove St
Your Personal Tour Guide
Ask me questions while you tour the home.