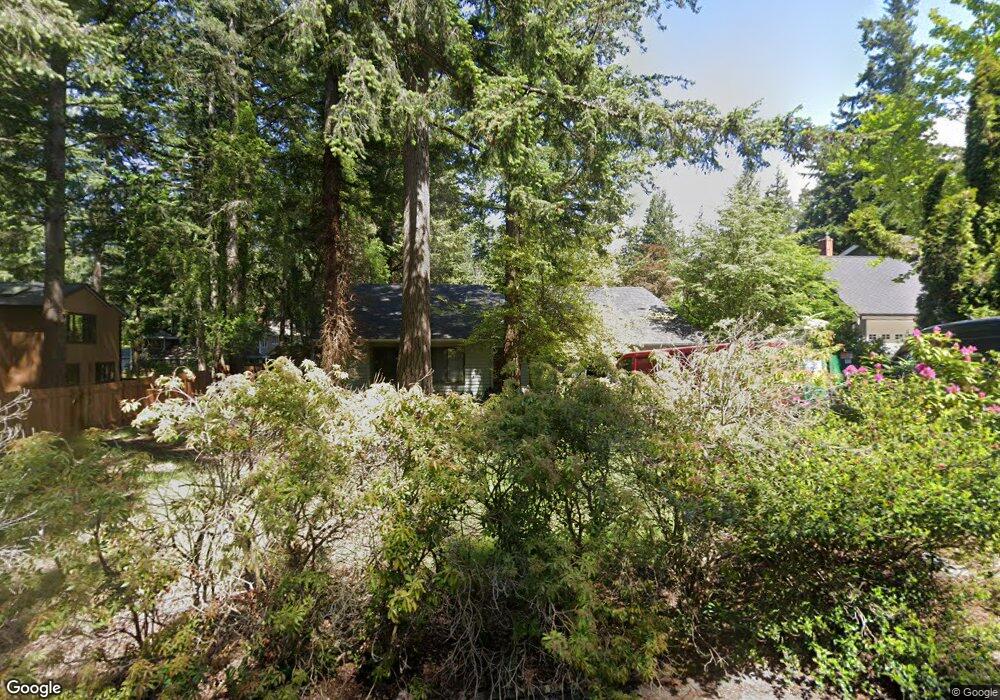
413 Viewcrest Rd Bellingham, WA 98229
Edgemoor NeighborhoodEstimated Value: $930,994 - $1,219,000
3
Beds
3
Baths
2,234
Sq Ft
$469/Sq Ft
Est. Value
About This Home
This home is located at 413 Viewcrest Rd, Bellingham, WA 98229 and is currently estimated at $1,047,499, approximately $468 per square foot. 413 Viewcrest Rd is a home located in Whatcom County with nearby schools including Lowell Elementary School, Fairhaven Middle School, and Sehome High School.
Ownership History
Date
Name
Owned For
Owner Type
Purchase Details
Closed on
Aug 13, 2013
Sold by
Olsen Elizabeth A
Bought by
Olsen Elizabeth A
Current Estimated Value
Purchase Details
Closed on
May 20, 2004
Sold by
Olsen Florence T
Bought by
Arthur W & Florence T Olsen Revocable Li and Olsen Florence T
Purchase Details
Closed on
Sep 25, 2002
Sold by
Arthur W & Florence T Olsen Revocable Li and Olsen Arthur W
Bought by
Olsen Florence T
Create a Home Valuation Report for This Property
The Home Valuation Report is an in-depth analysis detailing your home's value as well as a comparison with similar homes in the area
Home Values in the Area
Average Home Value in this Area
Purchase History
| Date | Buyer | Sale Price | Title Company |
|---|---|---|---|
| Olsen Elizabeth A | -- | None Available | |
| Arthur W & Florence T Olsen Revocable Li | -- | -- | |
| Olsen Florence T | -- | -- |
Source: Public Records
Tax History Compared to Growth
Tax History
| Year | Tax Paid | Tax Assessment Tax Assessment Total Assessment is a certain percentage of the fair market value that is determined by local assessors to be the total taxable value of land and additions on the property. | Land | Improvement |
|---|---|---|---|---|
| 2024 | $7,389 | $916,881 | $464,585 | $452,296 |
| 2023 | $7,389 | $949,662 | $481,195 | $468,467 |
| 2022 | $6,084 | $808,228 | $409,530 | $398,698 |
| 2021 | $5,780 | $651,814 | $330,275 | $321,539 |
| 2020 | $5,680 | $571,762 | $289,713 | $282,049 |
| 2019 | $5,249 | $542,726 | $275,000 | $267,726 |
| 2018 | $5,427 | $502,928 | $239,785 | $263,143 |
| 2017 | $4,787 | $446,419 | $212,840 | $233,579 |
| 2016 | $4,358 | $411,056 | $195,840 | $215,216 |
| 2015 | $4,290 | $389,838 | $185,640 | $204,198 |
| 2014 | -- | $371,265 | $176,800 | $194,465 |
| 2013 | -- | $353,631 | $170,000 | $183,631 |
Source: Public Records
Map
Nearby Homes
- 624 Clark Rd
- 507 Lyla Ln
- 505 Willow Rd
- 1301 Broad St
- 404 Willow Road Place
- 406 Willow Road Place
- 2600 16th St
- 405 Bayside Rd
- 425 Chuckanut Dr N Unit 5
- 331 Chuckanut Dr N
- 671 Chuckanut Dr N
- 214 Bayside Rd
- 697 Chuckanut Dr N
- 30 Shorewood Dr
- 1212 Old Fairhaven Pkwy Unit D202
- 707 Donovan Ave
- 1302 Larrabee Ave
- 1605 Donovan Ave
- 1902 Wilson Ave
- 910 Harris Ave Unit 208
- 409 Viewcrest Rd
- 663 Clark Rd
- 653 Hunters Pointe Dr
- 659 Clark Rd
- 651 Hunters Pointe Dr
- 405 Viewcrest Rd
- 655 Hunters Pointe Dr
- 401 Viewcrest Rd
- 664 Clark Rd
- 649 Hunters Pointe Dr
- 658 Clark Rd
- 643 Hunters Pointe Dr
- 647 Hunters Pointe Dr
- 639 Hunters Pointe Dr
- 654 Clark Rd
- 645 Hunters Pointe Dr
- 358 Viewcrest Rd
- 402 Viewcrest Rd
- 635 Fieldston Rd
- 355 Viewcrest Rd