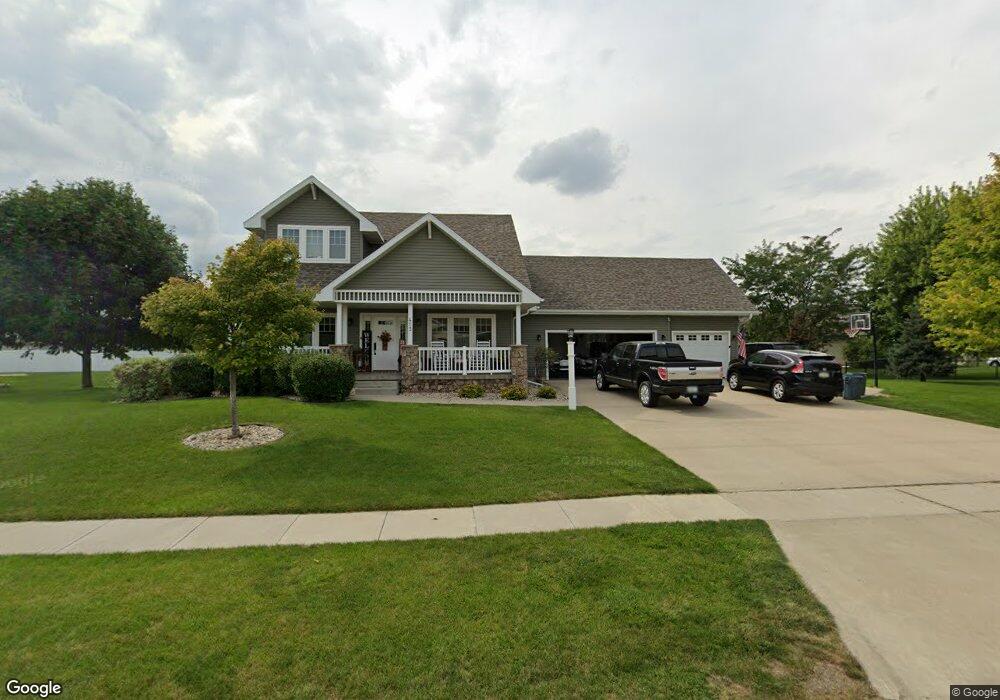
413 Windsor Way Sergeant Bluff, IA 51054
Estimated Value: $414,000 - $535,000
5
Beds
7
Baths
2,295
Sq Ft
$208/Sq Ft
Est. Value
About This Home
This home is located at 413 Windsor Way, Sergeant Bluff, IA 51054 and is currently estimated at $478,007, approximately $208 per square foot. 413 Windsor Way is a home with nearby schools including Sergeant Bluff-Luton Primary School, Sergeant Bluff-Luton Elementary School, and Sergeant Bluff-Luton Middle School.
Ownership History
Date
Name
Owned For
Owner Type
Purchase Details
Closed on
May 18, 2017
Sold by
Gale Kelley Michael and Gale Laura S
Bought by
Garrison Matthew D and Garrison Jennifer A
Current Estimated Value
Purchase Details
Closed on
Jan 23, 2014
Sold by
Gale Kelley Michael and Gale Laura S
Bought by
The Kelley Michael Gale And Laura S Gale
Purchase Details
Closed on
Sep 11, 2006
Sold by
Andrie Llc
Bought by
Klc Llc
Home Financials for this Owner
Home Financials are based on the most recent Mortgage that was taken out on this home.
Original Mortgage
$256,000
Interest Rate
6.7%
Mortgage Type
Credit Line Revolving
Create a Home Valuation Report for This Property
The Home Valuation Report is an in-depth analysis detailing your home's value as well as a comparison with similar homes in the area
Home Values in the Area
Average Home Value in this Area
Purchase History
| Date | Buyer | Sale Price | Title Company |
|---|---|---|---|
| Garrison Matthew D | $330,000 | None Available | |
| The Kelley Michael Gale And Laura S Gale | -- | None Available | |
| Klc Llc | $31,000 | -- |
Source: Public Records
Mortgage History
| Date | Status | Borrower | Loan Amount |
|---|---|---|---|
| Previous Owner | Klc Llc | $256,000 |
Source: Public Records
Tax History
| Year | Tax Paid | Tax Assessment Tax Assessment Total Assessment is a certain percentage of the fair market value that is determined by local assessors to be the total taxable value of land and additions on the property. | Land | Improvement |
|---|---|---|---|---|
| 2025 | -- | $464,570 | $60,710 | $403,860 |
| 2024 | -- | $430,770 | $49,260 | $381,510 |
| 2023 | -- | $430,770 | $49,260 | $381,510 |
| 2022 | $0 | $379,220 | $49,260 | $329,960 |
| 2021 | $0 | $379,220 | $49,260 | $329,960 |
| 2020 | $5,920 | $345,540 | $52,710 | $292,830 |
| 2019 | $6,012 | $345,540 | $52,710 | $292,830 |
| 2018 | $5,862 | $345,540 | $52,710 | $292,830 |
| 2017 | $5,862 | $345,540 | $52,710 | $292,830 |
| 2016 | $6,712 | $345,540 | $0 | $0 |
| 2015 | $6,057 | $322,930 | $49,260 | $273,670 |
| 2014 | $5,714 | $303,180 | $49,260 | $253,920 |
Source: Public Records
Map
Nearby Homes
- 410 Windsor Way
- 804 Clairmont Cir
- 417 Windsor Way
- 806 Clairmont Cir
- 414 Windsor Way
- 416 Windsor Way
- 418 Windsor Way
- 408 Windsor Way
- 808 Clairmont Cir
- 412 Windsor Way
- 420 Windsor Way
- 411 Windsor Way
- 404 Windsor Way
- 902 Rockwood Ct
- 501 Windsor Way
- 810 Clairmont
- 803 Clairmont Cir
- 409 Windsor Way
- 502 Windsor Way
- 1305 Clairmont Cir
Your Personal Tour Guide
Ask me questions while you tour the home.