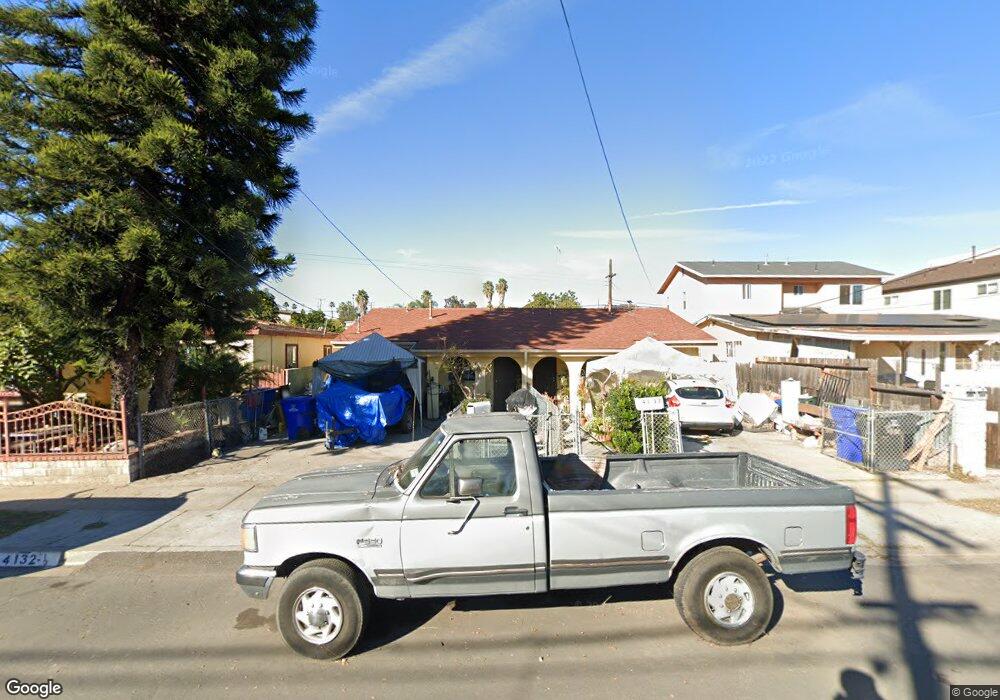
4130 Nordica St Unit 32 San Diego, CA 92113
Shelltown NeighborhoodEstimated Value: $666,000 - $761,000
4
Beds
2
Baths
1,195
Sq Ft
$600/Sq Ft
Est. Value
About This Home
This home is located at 4130 Nordica St Unit 32, San Diego, CA 92113 and is currently estimated at $716,545, approximately $599 per square foot. 4130 Nordica St Unit 32 is a home located in San Diego County with nearby schools including Balboa Elementary School, Knox Middle, and Lincoln High School.
Ownership History
Date
Name
Owned For
Owner Type
Purchase Details
Closed on
Sep 30, 2005
Sold by
Moran Sergio and Moran Lourdes
Bought by
Moran Sergio and Moran Lourdes
Current Estimated Value
Home Financials for this Owner
Home Financials are based on the most recent Mortgage that was taken out on this home.
Original Mortgage
$180,000
Outstanding Balance
$99,717
Interest Rate
6.32%
Mortgage Type
Stand Alone Refi Refinance Of Original Loan
Estimated Equity
$616,828
Purchase Details
Closed on
Jun 10, 2005
Sold by
Moran Sergio and Moran Lourdes
Bought by
Moran Sergio and Moran Lourdes
Purchase Details
Closed on
Jul 28, 2000
Sold by
Beas Simon L
Bought by
Moran Sergio and Moran Lourdes
Purchase Details
Closed on
Aug 22, 1996
Sold by
Beas Simon L and Beas Virginia R
Bought by
Beas Simon L
Purchase Details
Closed on
Aug 20, 1986
Create a Home Valuation Report for This Property
The Home Valuation Report is an in-depth analysis detailing your home's value as well as a comparison with similar homes in the area
Home Values in the Area
Average Home Value in this Area
Purchase History
| Date | Buyer | Sale Price | Title Company |
|---|---|---|---|
| Moran Sergio | -- | Lawyers Title San Diego | |
| Moran Sergio | -- | Lawyers Title | |
| Moran Sergio | -- | -- | |
| Moran Sergio | -- | -- | |
| Moran Sergio | -- | -- | |
| Beas Simon L | -- | -- | |
| -- | $18,000 | -- |
Source: Public Records
Mortgage History
| Date | Status | Borrower | Loan Amount |
|---|---|---|---|
| Open | Moran Sergio | $180,000 |
Source: Public Records
Tax History Compared to Growth
Tax History
| Year | Tax Paid | Tax Assessment Tax Assessment Total Assessment is a certain percentage of the fair market value that is determined by local assessors to be the total taxable value of land and additions on the property. | Land | Improvement |
|---|---|---|---|---|
| 2025 | $1,487 | $120,520 | $47,663 | $72,857 |
| 2024 | $1,487 | $118,158 | $46,729 | $71,429 |
| 2023 | $1,453 | $115,842 | $45,813 | $70,029 |
| 2022 | $1,415 | $113,571 | $44,915 | $68,656 |
| 2021 | $1,405 | $111,345 | $44,035 | $67,310 |
| 2020 | $1,389 | $110,204 | $43,584 | $66,620 |
| 2019 | $1,364 | $108,044 | $42,730 | $65,314 |
| 2018 | $1,277 | $105,927 | $41,893 | $64,034 |
| 2017 | $80 | $103,851 | $41,072 | $62,779 |
| 2016 | $1,225 | $101,816 | $40,267 | $61,549 |
| 2015 | $1,208 | $100,288 | $39,663 | $60,625 |
| 2014 | $1,190 | $98,325 | $38,887 | $59,438 |
Source: Public Records
Map
Nearby Homes
- 4188 Eta St
- 4046 Eta St Unit 48
- 4044 Eta St
- 2135-37 S 41st St
- 4123 Gamma St Unit 27
- 530 E 1st St
- 3964 Delta St
- 4398 Delta St Unit 8
- 3813-15 Birch St
- 3892 Beta St
- 1728 Vesta St
- 519 Highland Ave
- 706 D Ave
- 620 E 7th St
- 1121 E 6th St
- 4300 Newton Ave Unit 94
- 4300 Newton Ave Unit 106
- 4300 Newton Ave Unit 31
- 725 B Ave Unit 39
- 4064 National Ave
- 4122 Nordica St
- 4134 Nordica St
- 4142 Nordica Ave
- 4112 Nordica St
- 4112 Nordica Ave
- 4152 Nordica St
- 4142-52 Nordica Ave Unit 35-38
- 4121 Eta St Unit 23
- 4117 Eta St
- 4135 Eta St Unit 37
- 4106 Nordica St
- 4111 Eta St Unit 13
- 4143 Eta St
- 4127 Nordica St
- 4135 Nordica St
- 4119 Nordica St
- 4162 Nordica St
- 4143 Nordica St
- 4111 Nordica St
- 4155 Eta St