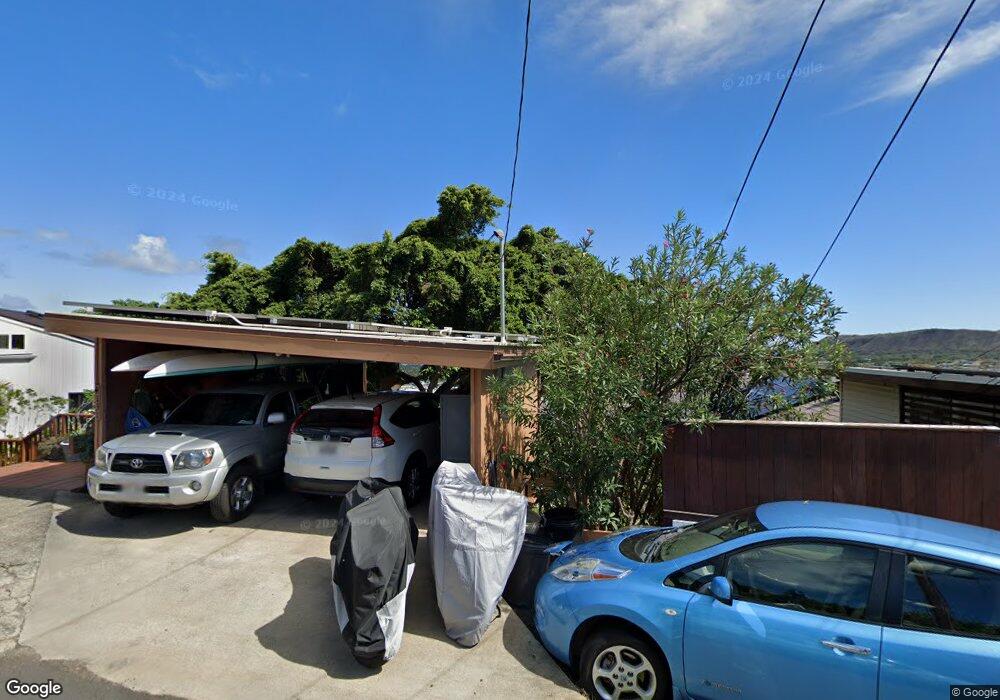
4131 Napali Place Unit 2 Honolulu, HI 96816
Kaimuki NeighborhoodEstimated Value: $921,455 - $1,876,000
3
Beds
2
Baths
774
Sq Ft
$1,657/Sq Ft
Est. Value
About This Home
This home is located at 4131 Napali Place Unit 2, Honolulu, HI 96816 and is currently estimated at $1,282,864, approximately $1,657 per square foot. 4131 Napali Place Unit 2 is a home located in Honolulu County with nearby schools including Kaimuki Middle School, Kalani High School, and Wai'alae Elementary Public Charter School.
Ownership History
Date
Name
Owned For
Owner Type
Purchase Details
Closed on
Sep 27, 2011
Sold by
Lattanzi John F and Lattanzi Karen K
Bought by
Lattanzi John F and Lattanzi Karen K
Current Estimated Value
Home Financials for this Owner
Home Financials are based on the most recent Mortgage that was taken out on this home.
Original Mortgage
$160,000
Outstanding Balance
$109,441
Interest Rate
4.16%
Mortgage Type
New Conventional
Estimated Equity
$1,173,423
Purchase Details
Closed on
Aug 8, 2011
Sold by
Woods Charles Edward
Bought by
Lattanzi John F and Lattanzi Karen K
Home Financials for this Owner
Home Financials are based on the most recent Mortgage that was taken out on this home.
Original Mortgage
$160,000
Outstanding Balance
$109,441
Interest Rate
4.16%
Mortgage Type
New Conventional
Estimated Equity
$1,173,423
Purchase Details
Closed on
Aug 22, 2000
Sold by
Toyofuku Robert Shigeo and Toyofuku Lynne Toshi
Bought by
Woods Charles Edward
Home Financials for this Owner
Home Financials are based on the most recent Mortgage that was taken out on this home.
Original Mortgage
$85,000
Interest Rate
8.15%
Create a Home Valuation Report for This Property
The Home Valuation Report is an in-depth analysis detailing your home's value as well as a comparison with similar homes in the area
Home Values in the Area
Average Home Value in this Area
Purchase History
| Date | Buyer | Sale Price | Title Company |
|---|---|---|---|
| Lattanzi John F | -- | Tg | |
| Lattanzi John F | $859,000 | Tg | |
| Woods Charles Edward | $158,000 | -- |
Source: Public Records
Mortgage History
| Date | Status | Borrower | Loan Amount |
|---|---|---|---|
| Open | Lattanzi John F | $160,000 | |
| Previous Owner | Woods Charles Edward | $85,000 |
Source: Public Records
Tax History Compared to Growth
Tax History
| Year | Tax Paid | Tax Assessment Tax Assessment Total Assessment is a certain percentage of the fair market value that is determined by local assessors to be the total taxable value of land and additions on the property. | Land | Improvement |
|---|---|---|---|---|
| 2025 | $3,218 | $981,700 | $837,500 | $144,200 |
| 2024 | $3,218 | $1,039,300 | $837,500 | $201,800 |
| 2023 | $2,595 | $941,400 | $773,100 | $168,300 |
| 2022 | $2,630 | $851,300 | $670,000 | $181,300 |
| 2021 | $2,304 | $758,300 | $635,600 | $122,700 |
| 2020 | $2,219 | $734,000 | $635,600 | $98,400 |
| 2019 | $2,282 | $732,000 | $635,600 | $96,400 |
| 2018 | $1,910 | $625,600 | $584,100 | $41,500 |
| 2017 | $1,892 | $620,700 | $571,200 | $49,500 |
| 2016 | $1,820 | $600,100 | $536,900 | $63,200 |
| 2015 | $2,449 | $779,700 | $579,800 | $199,900 |
| 2014 | $1,370 | $720,300 | $463,800 | $256,500 |
Source: Public Records
Map
Nearby Homes
- 4130 Keanu St Unit 4
- 1450 Hunakai St Unit 1
- 1603 Paula Dr
- 1617 Paula Dr Unit A
- 1627 Paula Dr Unit A
- 4229 Keanu St Unit 4
- 4202 Keanu St Unit 4
- 1457 Hunakai St Unit 1
- 1457 Hunakai St Unit 4
- 4212 Keanu St Unit 1
- 4842 Kilauea Ave Unit 4
- 4206 Keanu St Unit 2
- 4300 Waialae Ave Unit B601
- 4300 Waialae Ave Unit B1204
- 4300 Waialae Ave Unit A302
- 1319 16th Ave
- 3838 Claudine St Unit A
- 3841 Pukalani Place
- 4470 Wahinekoa Place
- 4026 Harding Ave
- 4131 Napali Place Unit 1
- 4133 Napali Place Unit 1
- 4129 Napali Place
- 4125 Napali Place
- 4128 Napali Place
- 4117 Napali Place
- 4118 Napali Place
- 4109 Napali Place
- 4118A Napali Place
- 4118B Napali Place
- 4132 Napali Place Unit 4132
- 4132 Napali Place Unit A
- 4132C Napali Place Unit 4132C
- 4132B Napali Place
- 4110 Napali Place
- 4036 Koko Dr
- 4128B Napali Place
- 49522 Kilauea Ave Unit 80
- 49403 Kilauea Ave Unit 89
- 4104 Napali Place