Estimated Value: $235,406 - $244,000
3
Beds
2
Baths
1
Sq Ft
$239,352/Sq Ft
Est. Value
About This Home
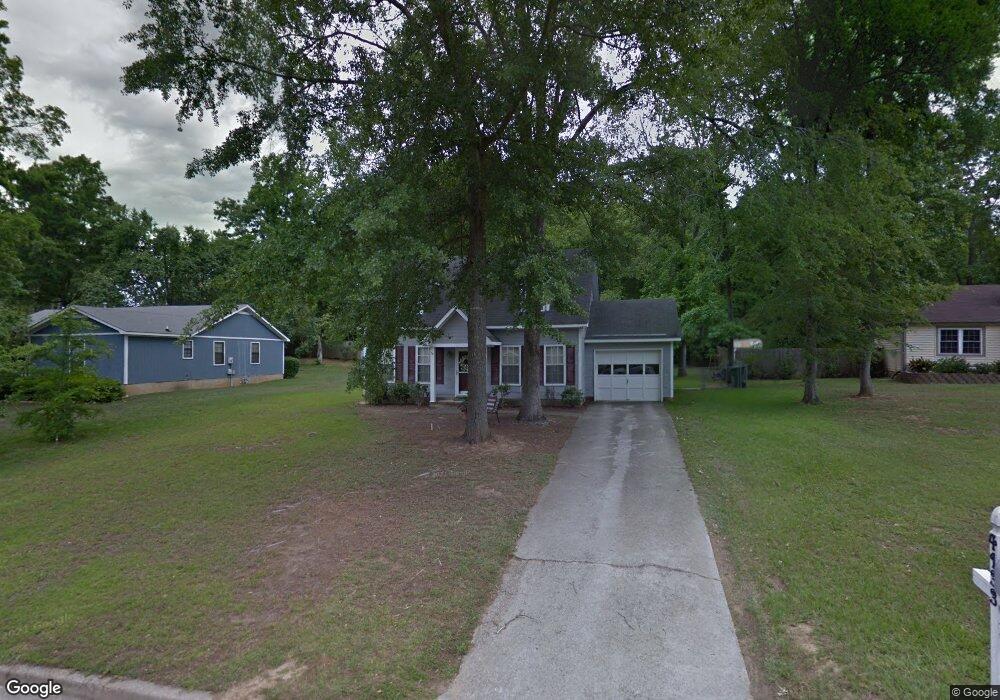
This home is located at 4133 Kemper Ct, Evans, GA 30809 and is currently estimated at $239,352, approximately $239,352 per square foot. 4133 Kemper Ct is a home located in Columbia County with nearby schools including Blue Ridge Elementary School, Lakeside Middle School, and Lakeside High School.
Ownership History
Date
Name
Owned For
Owner Type
Purchase Details
Closed on
Jul 24, 2007
Sold by
Carpenter Joseph C
Bought by
Painter Jill C
Current Estimated Value
Home Financials for this Owner
Home Financials are based on the most recent Mortgage that was taken out on this home.
Original Mortgage
$105,600
Outstanding Balance
$66,450
Interest Rate
6.63%
Mortgage Type
New Conventional
Estimated Equity
$172,902
Purchase Details
Closed on
May 9, 2005
Sold by
Carpenter Joseph C
Bought by
Carpenter Joseph C and Carpenter Sara Porter
Purchase Details
Closed on
Feb 16, 2005
Sold by
Carpenter Patricia C and Wayne Carpenter J
Bought by
Carpenter Joseph C
Purchase Details
Closed on
May 14, 2004
Sold by
Wood Gary W and Wood Angela Scott
Bought by
Carpenter J Wayne and Carpenter Patricia C
Create a Home Valuation Report for This Property
The Home Valuation Report is an in-depth analysis detailing your home's value as well as a comparison with similar homes in the area
Home Values in the Area
Average Home Value in this Area
Purchase History
| Date | Buyer | Sale Price | Title Company |
|---|---|---|---|
| Painter Jill C | $132,000 | -- | |
| Carpenter Joseph C | -- | -- | |
| Carpenter Joseph C | -- | -- | |
| Carpenter J Wayne | $105,000 | -- |
Source: Public Records
Mortgage History
| Date | Status | Borrower | Loan Amount |
|---|---|---|---|
| Open | Painter Jill C | $105,600 |
Source: Public Records
Tax History
| Year | Tax Paid | Tax Assessment Tax Assessment Total Assessment is a certain percentage of the fair market value that is determined by local assessors to be the total taxable value of land and additions on the property. | Land | Improvement |
|---|---|---|---|---|
| 2025 | $2,116 | $86,272 | $20,004 | $66,268 |
| 2024 | $1,818 | $70,415 | $15,204 | $55,211 |
| 2023 | $1,818 | $61,688 | $14,404 | $47,284 |
| 2022 | $1,821 | $67,802 | $15,304 | $52,498 |
| 2021 | $1,840 | $65,524 | $13,704 | $51,820 |
| 2020 | $1,770 | $61,641 | $13,104 | $48,537 |
| 2019 | $1,602 | $55,574 | $12,804 | $42,770 |
| 2018 | $1,409 | $48,450 | $10,804 | $37,646 |
| 2017 | $1,372 | $46,956 | $10,604 | $36,352 |
| 2016 | $1,391 | $49,412 | $11,580 | $37,832 |
| 2015 | $1,306 | $46,164 | $9,680 | $36,484 |
| 2014 | $1,244 | $43,320 | $9,280 | $34,040 |
Source: Public Records
Map
Nearby Homes
- 4126 Dunes Dr
- 634 Kemper Dr
- 652 King Taylor Rd
- 507 Meldon Rd
- 0 Commons Dr
- 218 Ryan Ln
- 2025 Grace Ave
- 541 Meldon Rd
- 7304 Malton Ct
- 7311 Malton Ct
- 4209 Fairfield Cir
- 615 Jones Landing Ct
- 3991 High Chaparral Dr
- 526 Oak Chase Dr
- 455 Bristol Rd
- 417 Blue Ridge Dr
- 305 Cimarron Place
- 836 Park Chase Dr
- 427 Bristol Rd
- 808 Shackleford Place
- 4135 Kemper Ct
- 4131 Kemper Ct
- 4064 Evans To Locks Rd
- 4138 Kemper Ct
- 4137 Kemper Ct
- 4132 Kemper Ct
- 4129 Kemper Ct
- 4142 Kemper Ct
- 4136 Kemper Ct
- 4139 Kemper Ct
- 4056 Evans To Locks Rd
- 4134 Kemper Ct
- 667 Kemper Dr
- 4144 Kemper Ct
- 4141 Kemper Ct
- 665 Kemper Dr
- 663 Kemper Dr
- 4143 Kemper Ct
- 685 Kemper Dr
- 4135 Sawgrass Ct
Your Personal Tour Guide
Ask me questions while you tour the home.