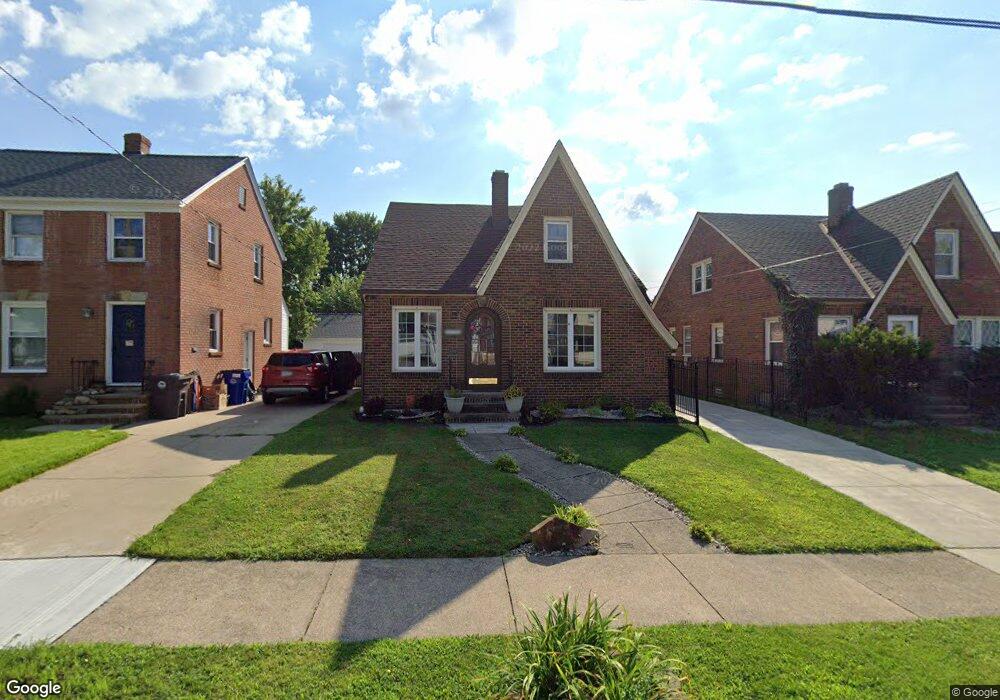
4133 W 50th St Cleveland, OH 44144
Old Brooklyn NeighborhoodEstimated Value: $153,325 - $207,000
3
Beds
1
Bath
1,364
Sq Ft
$132/Sq Ft
Est. Value
About This Home
This home is located at 4133 W 50th St, Cleveland, OH 44144 and is currently estimated at $179,581, approximately $131 per square foot. 4133 W 50th St is a home located in Cuyahoga County with nearby schools including Benjamin Franklin, Almira Academy, and Artemus Ward School.
Ownership History
Date
Name
Owned For
Owner Type
Purchase Details
Closed on
Nov 17, 2001
Sold by
Ptacek Joseph S
Bought by
Calderon Angel L and Calderon Sonia M
Current Estimated Value
Home Financials for this Owner
Home Financials are based on the most recent Mortgage that was taken out on this home.
Original Mortgage
$112,500
Outstanding Balance
$43,873
Interest Rate
6.69%
Estimated Equity
$135,708
Purchase Details
Closed on
May 11, 1998
Sold by
Vanburen David
Bought by
Ptacek Joseph S
Home Financials for this Owner
Home Financials are based on the most recent Mortgage that was taken out on this home.
Original Mortgage
$94,939
Interest Rate
7.2%
Mortgage Type
FHA
Purchase Details
Closed on
Jun 28, 1991
Sold by
Schmidt Rose J
Bought by
Vanburen David
Purchase Details
Closed on
Jul 28, 1978
Sold by
Schmidt Louis and Schmidt Rose
Bought by
Schmidt Rose J
Purchase Details
Closed on
Jan 1, 1975
Bought by
Schmidt Louis and Schmidt Rose
Create a Home Valuation Report for This Property
The Home Valuation Report is an in-depth analysis detailing your home's value as well as a comparison with similar homes in the area
Home Values in the Area
Average Home Value in this Area
Purchase History
| Date | Buyer | Sale Price | Title Company |
|---|---|---|---|
| Calderon Angel L | $112,500 | Cleveland Title | |
| Ptacek Joseph S | $95,000 | Phoenix Title | |
| Vanburen David | $67,000 | -- | |
| Schmidt Rose J | -- | -- | |
| Schmidt Louis | -- | -- |
Source: Public Records
Mortgage History
| Date | Status | Borrower | Loan Amount |
|---|---|---|---|
| Open | Calderon Angel L | $112,500 | |
| Closed | Ptacek Joseph S | $94,939 |
Source: Public Records
Tax History Compared to Growth
Tax History
| Year | Tax Paid | Tax Assessment Tax Assessment Total Assessment is a certain percentage of the fair market value that is determined by local assessors to be the total taxable value of land and additions on the property. | Land | Improvement |
|---|---|---|---|---|
| 2024 | $3,114 | $47,495 | $8,995 | $38,500 |
| 2023 | $2,257 | $29,750 | $6,090 | $23,660 |
| 2022 | $2,244 | $29,750 | $6,090 | $23,660 |
| 2021 | $2,221 | $29,750 | $6,090 | $23,660 |
| 2020 | $1,992 | $23,070 | $4,730 | $18,340 |
| 2019 | $1,842 | $65,900 | $13,500 | $52,400 |
| 2018 | $918 | $23,070 | $4,730 | $18,340 |
| 2017 | $1,689 | $20,480 | $4,030 | $16,450 |
| 2016 | $1,676 | $20,480 | $4,030 | $16,450 |
| 2015 | $2,418 | $20,480 | $4,030 | $16,450 |
| 2014 | $2,418 | $27,930 | $4,480 | $23,450 |
Source: Public Records
Map
Nearby Homes
- 4140 W 49th St
- 4109 W 50th St
- 4185 W 50th St
- 4098 W 57th St
- 4215 W 58th St
- 4373 W 52nd St
- 3923 Pensacola Ave
- 4102 Spokane Ave
- 4427 W 49th St
- 3909 Memphis Ave
- 3863 W 41st St
- 4456 W 49th St
- 3856 W 41st St
- 3810 Memphis Ave
- 4811 Ardmore Ave
- 3821 Spokane Ave
- 3532 Muriel Ave
- 6706 Woodhaven Ave
- 4615 Ardmore Ave
- 4484 W 53rd St