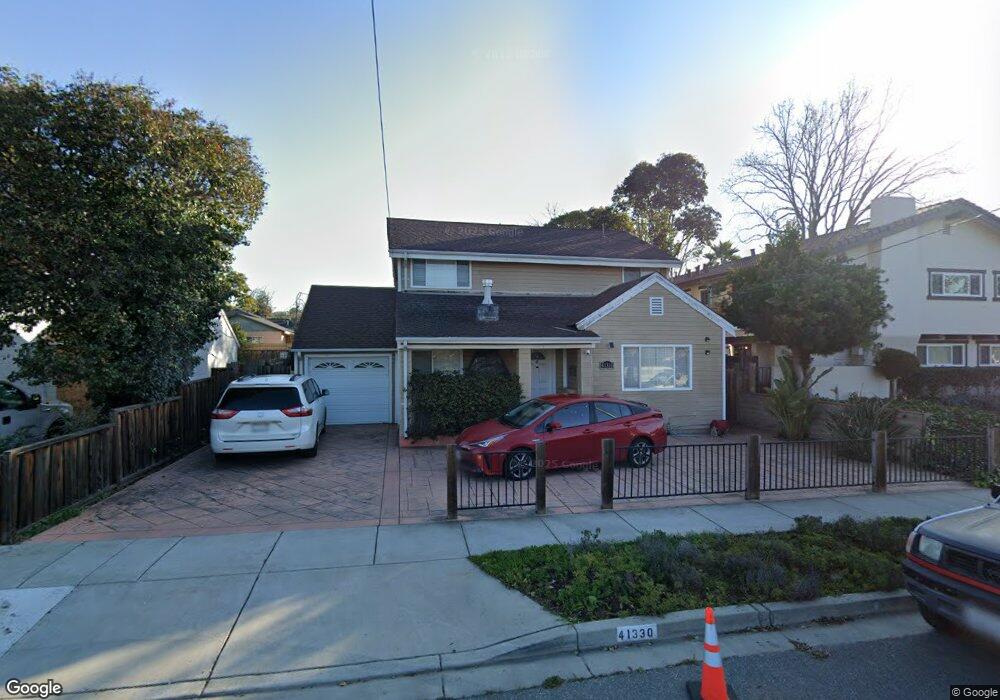
41330 Roberts Ave Fremont, CA 94538
Irvington NeighborhoodEstimated Value: $1,474,692 - $1,551,000
5
Beds
3
Baths
1,678
Sq Ft
$905/Sq Ft
Est. Value
About This Home
This home is located at 41330 Roberts Ave, Fremont, CA 94538 and is currently estimated at $1,518,173, approximately $904 per square foot. 41330 Roberts Ave is a home located in Alameda County with nearby schools including O. N. Hirsch Elementary School, John M. Horner Junior High School, and Irvington High School.
Ownership History
Date
Name
Owned For
Owner Type
Purchase Details
Closed on
Jan 6, 2015
Sold by
Chaidir Juliana and Liu Chin Chih
Bought by
Chaidir Juliana
Current Estimated Value
Purchase Details
Closed on
Jan 4, 2014
Sold by
Chairdir Juliana and Chaidir Juliana
Bought by
Chaidir Juliana
Purchase Details
Closed on
Dec 20, 2008
Sold by
Chaidir Juliana
Bought by
Chaidir Juliana and Liu Chin Chih
Purchase Details
Closed on
May 7, 2008
Sold by
Citibank Na
Bought by
Chairdir Juliana
Home Financials for this Owner
Home Financials are based on the most recent Mortgage that was taken out on this home.
Original Mortgage
$200,000
Outstanding Balance
$126,128
Interest Rate
5.8%
Mortgage Type
Purchase Money Mortgage
Estimated Equity
$1,392,045
Purchase Details
Closed on
Apr 29, 2008
Sold by
Ping Liu Chung
Bought by
Chaidir Juliana
Home Financials for this Owner
Home Financials are based on the most recent Mortgage that was taken out on this home.
Original Mortgage
$200,000
Outstanding Balance
$126,128
Interest Rate
5.8%
Mortgage Type
Purchase Money Mortgage
Estimated Equity
$1,392,045
Purchase Details
Closed on
May 23, 2007
Sold by
Costello Shawn
Bought by
Citibank Na
Purchase Details
Closed on
Aug 18, 2006
Sold by
Dangerfield Shawn
Bought by
Costello Shawn
Home Financials for this Owner
Home Financials are based on the most recent Mortgage that was taken out on this home.
Original Mortgage
$760,000
Interest Rate
7.62%
Mortgage Type
Purchase Money Mortgage
Purchase Details
Closed on
Apr 19, 2006
Sold by
Fairley Ricky L
Bought by
Dangerfield Shawn
Home Financials for this Owner
Home Financials are based on the most recent Mortgage that was taken out on this home.
Original Mortgage
$680,000
Interest Rate
8.45%
Mortgage Type
Fannie Mae Freddie Mac
Purchase Details
Closed on
Nov 11, 2005
Sold by
Azlzi Razek and Nawabi Susan
Bought by
Fairley Ricky L
Home Financials for this Owner
Home Financials are based on the most recent Mortgage that was taken out on this home.
Original Mortgage
$600,000
Interest Rate
7.6%
Mortgage Type
Fannie Mae Freddie Mac
Purchase Details
Closed on
Sep 3, 2004
Sold by
Almanza Hector Anthony and Estate Of Hector A Almanza
Bought by
Azizi Razek and Nawabi Susan
Home Financials for this Owner
Home Financials are based on the most recent Mortgage that was taken out on this home.
Original Mortgage
$360,000
Interest Rate
6.5%
Mortgage Type
Purchase Money Mortgage
Create a Home Valuation Report for This Property
The Home Valuation Report is an in-depth analysis detailing your home's value as well as a comparison with similar homes in the area
Home Values in the Area
Average Home Value in this Area
Purchase History
| Date | Buyer | Sale Price | Title Company |
|---|---|---|---|
| Chaidir Juliana | -- | None Available | |
| Chaidir Juliana | -- | None Available | |
| Chaidir Juliana | -- | None Available | |
| Chairdir Juliana | $530,000 | Cornerstone Title Co | |
| Chaidir Juliana | -- | Cornerstone Title Co | |
| Citibank Na | $805,594 | None Available | |
| Costello Shawn | $950,000 | Ticor Title Co Of California | |
| Dangerfield Shawn | $855,000 | Chicago Title Co | |
| Fairley Ricky L | $765,000 | Ticor Title Company Of Ca | |
| Azizi Razek | $450,000 | Ticor Title Company Of Ca |
Source: Public Records
Mortgage History
| Date | Status | Borrower | Loan Amount |
|---|---|---|---|
| Open | Chairdir Juliana | $200,000 | |
| Previous Owner | Costello Shawn | $760,000 | |
| Previous Owner | Dangerfield Shawn | $680,000 | |
| Previous Owner | Fairley Ricky L | $600,000 | |
| Previous Owner | Azizi Razek | $360,000 | |
| Closed | Azizi Razek | $90,000 |
Source: Public Records
Tax History Compared to Growth
Tax History
| Year | Tax Paid | Tax Assessment Tax Assessment Total Assessment is a certain percentage of the fair market value that is determined by local assessors to be the total taxable value of land and additions on the property. | Land | Improvement |
|---|---|---|---|---|
| 2025 | $8,482 | $689,291 | $206,787 | $482,504 |
| 2024 | $8,482 | $675,778 | $202,733 | $473,045 |
| 2023 | $8,251 | $662,531 | $198,759 | $463,772 |
| 2022 | $8,140 | $649,543 | $194,863 | $454,680 |
| 2021 | $7,942 | $636,810 | $191,043 | $445,767 |
| 2020 | $7,946 | $630,283 | $189,085 | $441,198 |
| 2019 | $7,857 | $617,928 | $185,378 | $432,550 |
| 2018 | $7,704 | $605,815 | $181,744 | $424,071 |
| 2017 | $7,513 | $593,938 | $178,181 | $415,757 |
| 2016 | $7,383 | $582,294 | $174,688 | $407,606 |
| 2015 | $7,283 | $573,551 | $172,065 | $401,486 |
| 2014 | $7,157 | $562,321 | $168,696 | $393,625 |
Source: Public Records
Map
Nearby Homes
- 3800 Adams Ave
- 41212 Fremont Blvd
- 3918 Fossano Common
- 3872 Wildflower Common Unit 27
- 3923 Wildflower Common Unit 19
- 41538 Casabella Common
- 3331 Union St
- 2785 Washington Blvd
- 41620 Beatrice St
- 40769 Squill Common
- 41882 Gifford St
- 2851 Finca Terrace
- 40708 Fremont Blvd
- 4310 Providence Terrace
- 4463 Hyde Common Unit 306
- 42759 Newport Dr
- 4214 Providence Terrace
- 40425 Chapel Way Unit 214
- 40425 Chapel Way Unit 309
- 4309 Bora Ave
- 41318 Roberts Ave
- 41342 Roberts Ave
- 3746 Adams Ave
- 3710 Adams Ave
- 3791 Adams Ave
- 3781 Adams Ave
- 3771 Adams Ave
- 41333 Roberts Ave
- 3741 Adams Ave
- 41276 Roberts Ave
- 3680 Adams Ave
- 3761 Adams Ave
- 41362 Roberts Ave
- 3731 Adams Ave
- 3751 Adams Ave
- 41345 Roberts Ave
- 3701 Adams Ave
- 3721 Adams Ave
- 3656 Adams Ave
- 41368 Roberts Ave