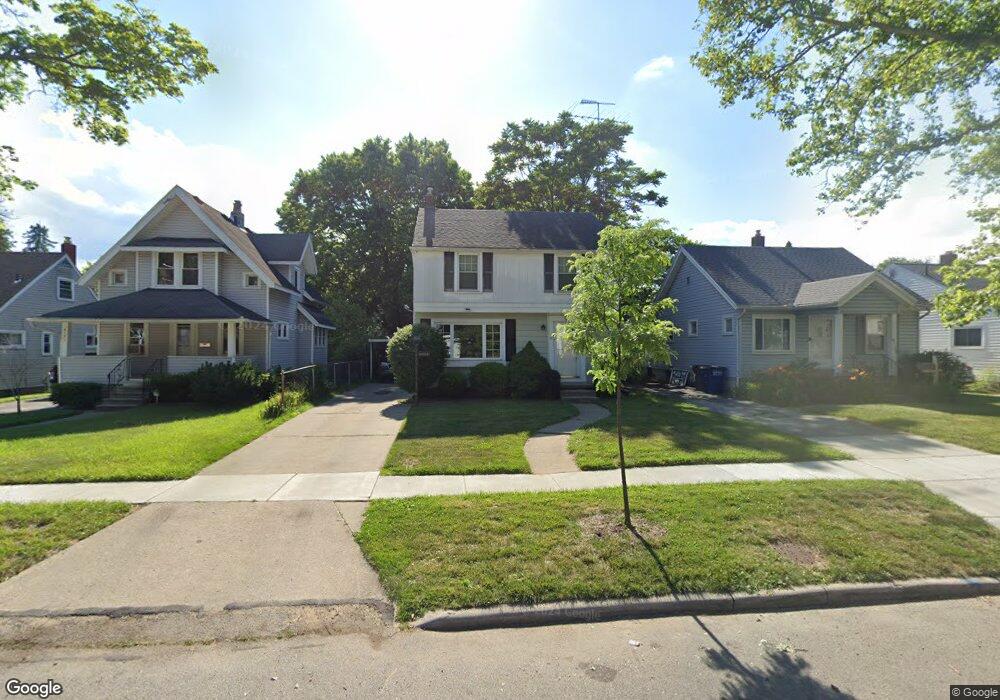
4135 Bowen Rd Toledo, OH 43613
DeVeaux NeighborhoodEstimated Value: $141,000 - $171,000
3
Beds
2
Baths
1,098
Sq Ft
$145/Sq Ft
Est. Value
About This Home
This home is located at 4135 Bowen Rd, Toledo, OH 43613 and is currently estimated at $158,734, approximately $144 per square foot. 4135 Bowen Rd is a home located in Lucas County with nearby schools including Elmhurst Elementary School, Start High School, and Horizon Science Academy - Toledo High School.
Ownership History
Date
Name
Owned For
Owner Type
Purchase Details
Closed on
Jun 1, 2021
Sold by
Canales Chad C
Bought by
Canales Chad C & Benjawan Trustees
Current Estimated Value
Home Financials for this Owner
Home Financials are based on the most recent Mortgage that was taken out on this home.
Interest Rate
2.95%
Purchase Details
Closed on
May 28, 2021
Sold by
Canales Chad C and Canales Chad
Bought by
Canales Chad C and Canales Benjawan
Home Financials for this Owner
Home Financials are based on the most recent Mortgage that was taken out on this home.
Interest Rate
2.95%
Purchase Details
Closed on
Jul 31, 1998
Sold by
Mikolajczyk Mary Ann and Mikolajczyk Mary A
Bought by
Canales Chad C
Home Financials for this Owner
Home Financials are based on the most recent Mortgage that was taken out on this home.
Original Mortgage
$83,000
Interest Rate
7.03%
Purchase Details
Closed on
Oct 26, 1992
Sold by
Mikolajczyk D A and M A
Create a Home Valuation Report for This Property
The Home Valuation Report is an in-depth analysis detailing your home's value as well as a comparison with similar homes in the area
Home Values in the Area
Average Home Value in this Area
Purchase History
| Date | Buyer | Sale Price | Title Company |
|---|---|---|---|
| Canales Chad C & Benjawan Trustees | $1 | -- | |
| Canales Chad C | -- | None Available | |
| Canales Chad C | $87,400 | Midland | |
| -- | -- | -- |
Source: Public Records
Mortgage History
| Date | Status | Borrower | Loan Amount |
|---|---|---|---|
| Closed | Canales Chad C & Benjawan Trustees | -- | |
| Previous Owner | Canales Chad C | $83,000 |
Source: Public Records
Tax History Compared to Growth
Tax History
| Year | Tax Paid | Tax Assessment Tax Assessment Total Assessment is a certain percentage of the fair market value that is determined by local assessors to be the total taxable value of land and additions on the property. | Land | Improvement |
|---|---|---|---|---|
| 2024 | $1,488 | $49,455 | $7,070 | $42,385 |
| 2023 | $2,335 | $36,890 | $6,370 | $30,520 |
| 2022 | $2,333 | $36,890 | $6,370 | $30,520 |
| 2021 | $2,395 | $36,890 | $6,370 | $30,520 |
| 2020 | $2,253 | $30,695 | $5,320 | $25,375 |
| 2019 | $2,202 | $30,695 | $5,320 | $25,375 |
| 2018 | $2,047 | $30,695 | $5,320 | $25,375 |
| 2017 | $1,922 | $25,200 | $4,690 | $20,510 |
| 2016 | $1,914 | $72,000 | $13,400 | $58,600 |
| 2015 | $1,896 | $72,000 | $13,400 | $58,600 |
| 2014 | $1,585 | $25,200 | $4,690 | $20,510 |
| 2013 | $1,585 | $25,200 | $4,690 | $20,510 |
Source: Public Records
Map
Nearby Homes
- 4210 Bowen Rd
- 4250 Garrison Rd
- 4211 Elmhurst Rd
- 2645 Grantwood Dr
- 2624 Grantwood Dr
- 2640 Westbrook Dr
- 3840 Garrison Rd
- 3905 Rushland Ave
- 4440 Woodmont Rd
- 2560 Charlestown Ave
- 2855 Castleton Ave
- 3805 Garrison Rd
- 2728 Castleton Ave
- 4128 Douglas Rd
- 3806 Doty Dr
- 3739 Garrison Rd
- 4024 Crary Dr
- 2447 Portsmouth Ave
- 3647 Elmhurst Rd
- 2433 Georgetown Ave
- 4139 Bowen Rd
- 4127 Bowen Rd
- 4143 Bowen Rd
- 4123 Bowen Rd
- 4147 Bowen Rd
- 4136 Grantley Rd
- 4132 Grantley Rd
- 4140 Grantley Rd
- 4119 Bowen Rd
- 4128 Grantley Rd
- 4144 Grantley Rd
- 4151 Bowen Rd
- 4124 Grantley Rd
- 4148 Grantley Rd
- 4136 Bowen Rd
- 4140 Bowen Rd
- 4132 Bowen Rd
- 4115 Bowen Rd
- 4155 Bowen Rd
- 4128 Bowen Rd