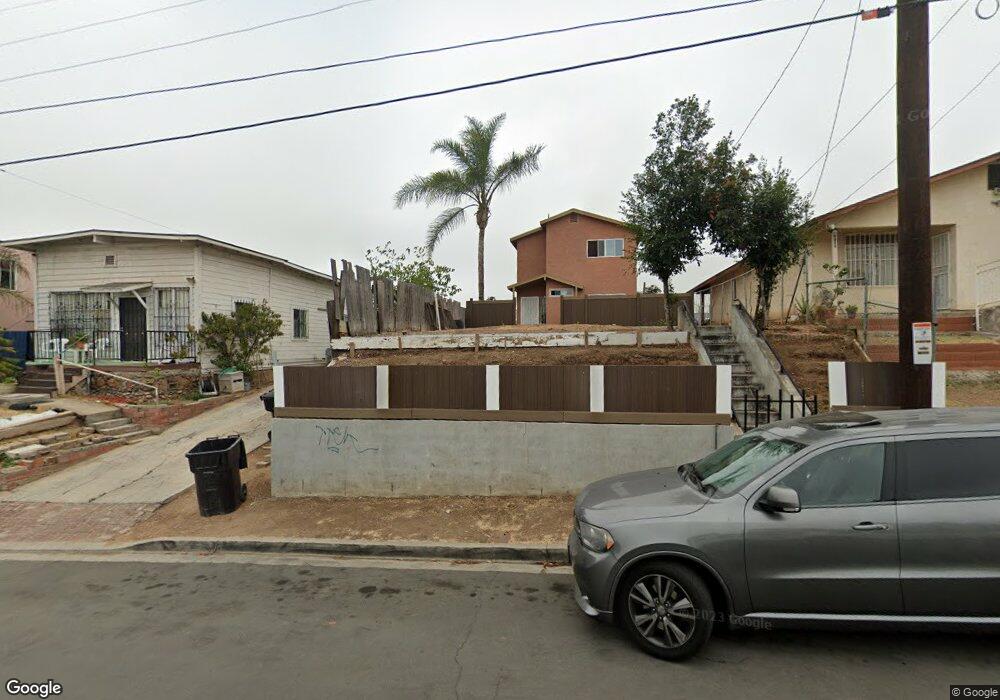
4135 C St San Diego, CA 92102
Mount Hope NeighborhoodEstimated Value: $641,000 - $805,000
3
Beds
2
Baths
1,360
Sq Ft
$537/Sq Ft
Est. Value
About This Home
This home is located at 4135 C St, San Diego, CA 92102 and is currently estimated at $730,932, approximately $537 per square foot. 4135 C St is a home located in San Diego County with nearby schools including Chollas/Mead Elementary School, Millennial Tech Middle School, and Lincoln High School.
Ownership History
Date
Name
Owned For
Owner Type
Purchase Details
Closed on
May 27, 2010
Sold by
Nguyen Namghi Myhanh
Bought by
Nguyen Steven
Current Estimated Value
Purchase Details
Closed on
May 18, 2010
Sold by
Beneficial Financial I Inc
Bought by
Nguyen Steven and Nguyen Danny
Purchase Details
Closed on
Feb 11, 2010
Sold by
Morales Gilberto C and Morales Guadalupe Barajas
Bought by
Beneficial California Inc
Purchase Details
Closed on
Nov 24, 1999
Sold by
Guadalupe Barajas and Barajas Guadalupe Barajas
Bought by
Morales Gilberto C and Morales Guadalupe Barajas
Home Financials for this Owner
Home Financials are based on the most recent Mortgage that was taken out on this home.
Original Mortgage
$104,145
Interest Rate
7.84%
Mortgage Type
FHA
Purchase Details
Closed on
Oct 24, 1991
Create a Home Valuation Report for This Property
The Home Valuation Report is an in-depth analysis detailing your home's value as well as a comparison with similar homes in the area
Home Values in the Area
Average Home Value in this Area
Purchase History
| Date | Buyer | Sale Price | Title Company |
|---|---|---|---|
| Nguyen Steven | -- | Integrated Title | |
| Nguyen Danny | -- | Integrated Title | |
| Nguyen Steven | $177,500 | None Available | |
| Beneficial California Inc | $207,180 | Accommodation | |
| Morales Gilberto C | -- | Fidelity National Title | |
| -- | $111,500 | -- |
Source: Public Records
Mortgage History
| Date | Status | Borrower | Loan Amount |
|---|---|---|---|
| Previous Owner | Morales Gilberto C | $104,145 |
Source: Public Records
Tax History Compared to Growth
Tax History
| Year | Tax Paid | Tax Assessment Tax Assessment Total Assessment is a certain percentage of the fair market value that is determined by local assessors to be the total taxable value of land and additions on the property. | Land | Improvement |
|---|---|---|---|---|
| 2025 | $2,794 | $229,106 | $83,896 | $145,210 |
| 2024 | $2,794 | $224,614 | $82,251 | $142,363 |
| 2023 | $2,731 | $220,211 | $80,639 | $139,572 |
| 2022 | $2,659 | $215,894 | $79,058 | $136,836 |
| 2021 | $2,641 | $211,661 | $77,508 | $134,153 |
| 2020 | $2,609 | $209,492 | $76,714 | $132,778 |
| 2019 | $2,563 | $205,385 | $75,210 | $130,175 |
| 2018 | $2,398 | $201,359 | $73,736 | $127,623 |
| 2017 | $2,341 | $197,412 | $72,291 | $125,121 |
| 2016 | $2,302 | $193,542 | $70,874 | $122,668 |
| 2015 | $2,269 | $190,636 | $69,810 | $120,826 |
| 2014 | $2,234 | $186,903 | $68,443 | $118,460 |
Source: Public Records
Map
Nearby Homes
- 1020 41st St
- 821
- 4264 Market St
- 530 42nd St Unit 1 & 2
- 514 42nd St
- 441-43 Morrison St
- 1720 Midvale Dr
- 4225 J St
- 3688 Cactusview Dr
- 3665 Ash St Unit 7
- 1505 Bridgeview Dr
- 4216 Posey Place
- 1804 Colonial Ave
- 1480 Bridgeview Dr
- 740 Cotton St
- 1742 Rowan St
- 3171 3175 K St
- 441 443 N 41st St
- 348 & 350 27th St
- 2035 Haller St
- 4131 C St
- 4141 C St
- 4123 C St
- 4149 C St Unit 51
- 4115 C St
- 4155 C St
- 41st & C St Development Opportunity Unit 43 & 44
- 41st & C St Development Opportunity
- 4148 Broadway
- 4124 Broadway
- 42nd & C S Development Opportunity
- 41st & C S Development Opportunity
- 4105 C St
- 4120 C St
- 42nd & C Street Development Opportunity Unit 43 & 44
- 42nd & C Street Development Opportunity
- 4171 C St
- 4124 C St
- 4103 C St
- 4156 Broadway