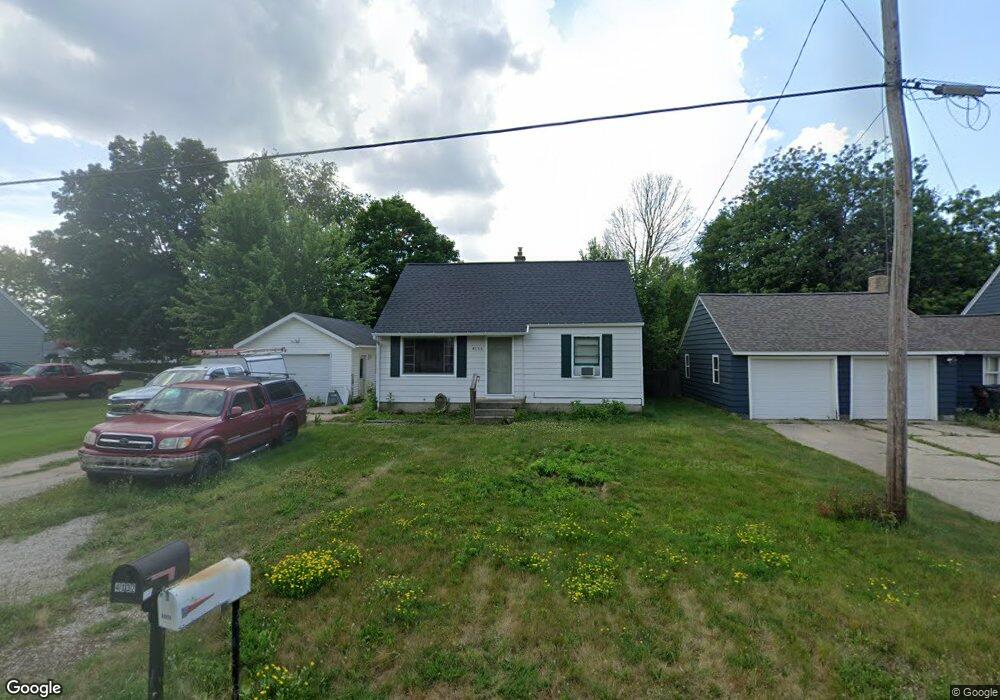
4135 Costa Ave NE Grand Rapids, MI 49525
Northview NeighborhoodEstimated Value: $202,000 - $266,572
3
Beds
1
Bath
1,350
Sq Ft
$167/Sq Ft
Est. Value
About This Home
This home is located at 4135 Costa Ave NE, Grand Rapids, MI 49525 and is currently estimated at $225,393, approximately $166 per square foot. 4135 Costa Ave NE is a home located in Kent County with nearby schools including West Oakview Elementary School, North Oakview Elementary School, and East Oakview Elementary School.
Ownership History
Date
Name
Owned For
Owner Type
Purchase Details
Closed on
Jun 24, 2025
Sold by
Moroney Rachael E and Grifford Rachael E
Bought by
Moroney Michael
Current Estimated Value
Home Financials for this Owner
Home Financials are based on the most recent Mortgage that was taken out on this home.
Original Mortgage
$194,000
Outstanding Balance
$193,835
Interest Rate
6.81%
Mortgage Type
New Conventional
Estimated Equity
$31,558
Purchase Details
Closed on
Dec 28, 2016
Sold by
Kitson Alan D and Kitson Joan E
Bought by
Moroney Rachael E
Home Financials for this Owner
Home Financials are based on the most recent Mortgage that was taken out on this home.
Original Mortgage
$98,188
Interest Rate
4.03%
Mortgage Type
FHA
Purchase Details
Closed on
Aug 12, 1999
Sold by
Ball Scott G
Bought by
Butts Jeromy and Kitson Alan D
Purchase Details
Closed on
Jun 9, 1995
Sold by
Racey Dale K
Bought by
Ball Scott and Kitson Alan D
Create a Home Valuation Report for This Property
The Home Valuation Report is an in-depth analysis detailing your home's value as well as a comparison with similar homes in the area
Home Values in the Area
Average Home Value in this Area
Purchase History
| Date | Buyer | Sale Price | Title Company |
|---|---|---|---|
| Moroney Michael | $200,000 | None Listed On Document | |
| Moroney Rachael E | $100,000 | Sun Title Agency Of Michigan | |
| Butts Jeromy | $97,500 | -- | |
| Ball Scott | $67,500 | -- |
Source: Public Records
Mortgage History
| Date | Status | Borrower | Loan Amount |
|---|---|---|---|
| Open | Moroney Michael | $194,000 | |
| Previous Owner | Moroney Rachael E | $62,200 | |
| Previous Owner | Moroney Rachael E | $84,296 | |
| Previous Owner | Moroney Rachael E | $83,000 | |
| Previous Owner | Moroney Rachael E | $98,188 | |
| Previous Owner | Kitson Alan D | $89,000 |
Source: Public Records
Tax History Compared to Growth
Tax History
| Year | Tax Paid | Tax Assessment Tax Assessment Total Assessment is a certain percentage of the fair market value that is determined by local assessors to be the total taxable value of land and additions on the property. | Land | Improvement |
|---|---|---|---|---|
| 2025 | $1,545 | $107,000 | $0 | $0 |
| 2024 | $1,545 | $93,300 | $0 | $0 |
| 2023 | $1,478 | $83,300 | $0 | $0 |
| 2022 | $2,187 | $80,200 | $0 | $0 |
| 2021 | $2,131 | $75,000 | $0 | $0 |
| 2020 | $1,362 | $68,800 | $0 | $0 |
| 2019 | $2,082 | $64,900 | $0 | $0 |
| 2018 | $2,039 | $60,300 | $0 | $0 |
| 2017 | $2,031 | $55,100 | $0 | $0 |
| 2016 | $2,332 | $50,600 | $0 | $0 |
| 2015 | $2,329 | $50,600 | $0 | $0 |
| 2013 | -- | $46,300 | $0 | $0 |
Source: Public Records
Map
Nearby Homes
- 1940 Eldon St NE
- 4148 Chadwick Ave NE
- 4372 Hunsberger Ave NE
- 3886 Vineyard Ave NE
- 4750 Hunsberger Ave NE
- 2258-B Edgewater Dr NE
- 3750 Benjamin Ave NE
- 2285-2289 Airway St NE
- 2289 Airway St NE
- 2285 Airway St NE
- 1444 Mark St NE
- 2233 Airway St NE
- 1860 Kreft St NE
- 1710 Kreft St NE
- 1985 Oakcliff Dr NE
- 4611 Plainfield Ave NE
- 3895 Keeweenaw Dr NE
- 3710 Siebers Ln NE
- 2313 4 Mile Rd NE
- 3801 Keeweenaw Dr NE
- 4123 Costa Ave NE
- 4147 Costa Ave NE
- 4136 Hillsdale Ave NE
- 4140 Hillsdale Ave NE
- 4124 Hillsdale Ave NE
- 4157 Costa Ave NE
- 4148 Hillsdale Ave NE
- 4118 Hillsdale Ave NE
- 4142 Costa Ave NE
- 4122 Costa Ave NE
- 4150 Costa Ave NE
- 4114 Hillsdale Ave NE
- 4156 Hillsdale Ave NE
- 4165 Costa Ave NE
- 4113 Costa Ave NE
- 4110 Costa Ave NE
- 4135 Bell Ave NE
- 4135 Hillsdale Ave NE
- 4141 Bell Ave NE
- 4141 Hillsdale Ave NE