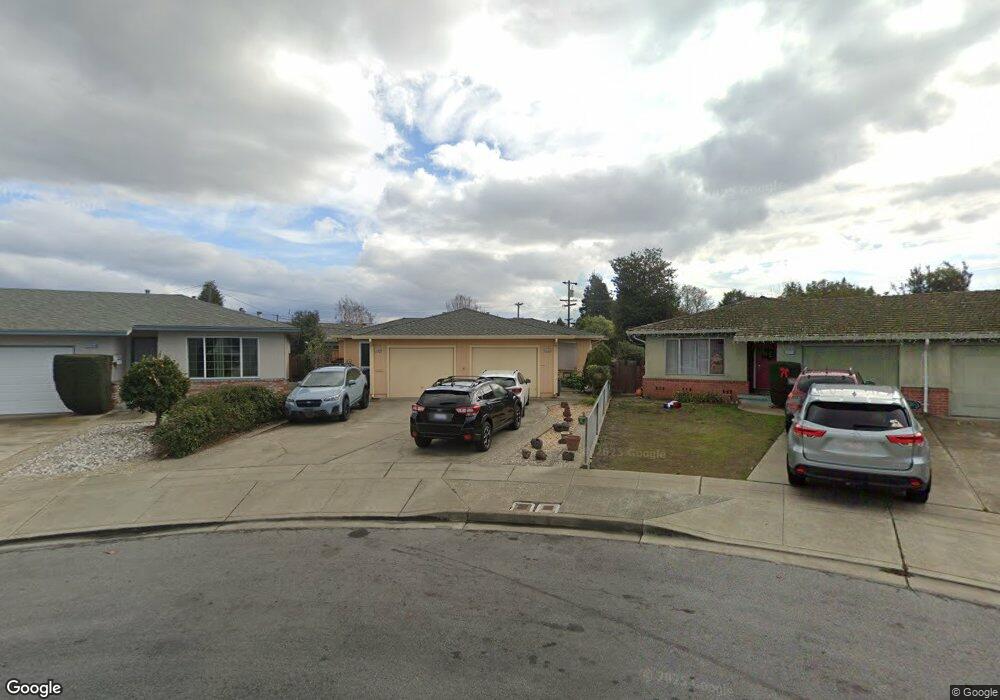
4136 Avalon Ct Fremont, CA 94536
Glenmoor NeighborhoodEstimated Value: $1,414,000 - $2,206,000
4
Beds
2
Baths
2,410
Sq Ft
$784/Sq Ft
Est. Value
About This Home
This home is located at 4136 Avalon Ct, Fremont, CA 94536 and is currently estimated at $1,889,740, approximately $784 per square foot. 4136 Avalon Ct is a home located in Alameda County with nearby schools including Glenmoor Elementary School, Centerville Junior High School, and Washington High School.
Ownership History
Date
Name
Owned For
Owner Type
Purchase Details
Closed on
Jan 7, 2000
Sold by
Silveira John and Silveira Emilio
Bought by
Silveira John A and Silveira Teresa J
Current Estimated Value
Home Financials for this Owner
Home Financials are based on the most recent Mortgage that was taken out on this home.
Original Mortgage
$350,000
Interest Rate
7.5%
Mortgage Type
Stand Alone First
Purchase Details
Closed on
Nov 24, 1999
Sold by
Silveira Theresa
Bought by
Silveira John
Home Financials for this Owner
Home Financials are based on the most recent Mortgage that was taken out on this home.
Original Mortgage
$350,000
Interest Rate
7.5%
Mortgage Type
Stand Alone First
Purchase Details
Closed on
Nov 23, 1999
Sold by
Young Clinton and Madansky Living Trust
Bought by
Silveira John and Silveira Emilio
Home Financials for this Owner
Home Financials are based on the most recent Mortgage that was taken out on this home.
Original Mortgage
$350,000
Interest Rate
7.5%
Mortgage Type
Stand Alone First
Purchase Details
Closed on
Sep 14, 1995
Sold by
Madansky W G
Bought by
Madansky W G
Create a Home Valuation Report for This Property
The Home Valuation Report is an in-depth analysis detailing your home's value as well as a comparison with similar homes in the area
Home Values in the Area
Average Home Value in this Area
Purchase History
| Date | Buyer | Sale Price | Title Company |
|---|---|---|---|
| Silveira John A | -- | -- | |
| Silveira John | -- | Chicago Title Co | |
| Silveira John | $390,000 | Chicago Title Co | |
| Madansky W G | -- | -- |
Source: Public Records
Mortgage History
| Date | Status | Borrower | Loan Amount |
|---|---|---|---|
| Previous Owner | Silveira John | $350,000 |
Source: Public Records
Tax History Compared to Growth
Tax History
| Year | Tax Paid | Tax Assessment Tax Assessment Total Assessment is a certain percentage of the fair market value that is determined by local assessors to be the total taxable value of land and additions on the property. | Land | Improvement |
|---|---|---|---|---|
| 2025 | $7,929 | $592,386 | $179,816 | $419,570 |
| 2024 | $7,929 | $580,635 | $176,290 | $411,345 |
| 2023 | $7,689 | $576,115 | $172,834 | $403,281 |
| 2022 | $7,553 | $557,820 | $169,446 | $395,374 |
| 2021 | $7,387 | $546,748 | $166,124 | $387,624 |
| 2020 | $7,272 | $548,074 | $164,422 | $383,652 |
| 2019 | $7,193 | $537,330 | $161,199 | $376,131 |
| 2018 | $7,047 | $526,795 | $158,038 | $368,757 |
| 2017 | $6,869 | $516,468 | $154,940 | $361,528 |
| 2016 | $6,741 | $506,344 | $151,903 | $354,441 |
| 2015 | $6,647 | $498,738 | $149,621 | $349,117 |
| 2014 | $6,532 | $488,970 | $146,691 | $342,279 |
Source: Public Records
Map
Nearby Homes
- 3810 Burton Common
- 38265 Corrigan Ct
- Plan 1629 at Veranda
- Plan 1165 at Veranda
- Plan 1670 at Veranda
- Plan 1455 at Veranda
- Plan 1394 at Veranda
- Plan 1725 at Veranda
- Plan 1378 at Veranda
- Plan 1657 at Veranda
- 3833 Burton Common
- 4328 Cognina Ct
- 38030 Dundee Common
- 37637 Canterbury St
- 4586 Norris Rd
- 37621 Glenmoor Dr
- 3507 Buttonwood Terrace Unit 203
- 4237 Garland Dr
- 3300 Red Cedar Terrace Unit LU25
- 3530 Oakwood Terrace Unit 102
- 4152 Avalon Ct
- 4120 Avalon Ct
- 4157 Lombard Ave
- 37864 Palmer Dr
- 37849 Argyle Rd Unit B
- 37849 Argyle Rd
- 37848 Palmer Dr
- 37827 Argyle Rd
- 4217 Lombard Ave
- 4151 Avalon Ct
- 4129 Lombard Ave
- 37832 Palmer Dr
- 4135 Avalon Ct
- 4119 Avalon Ct
- 37880 Palmer Dr
- 37747 Argyle Rd
- 37836 Argyle Rd
- 4154 Lombard Ave
- 37816 Palmer Dr
- 4138 Lombard Ave