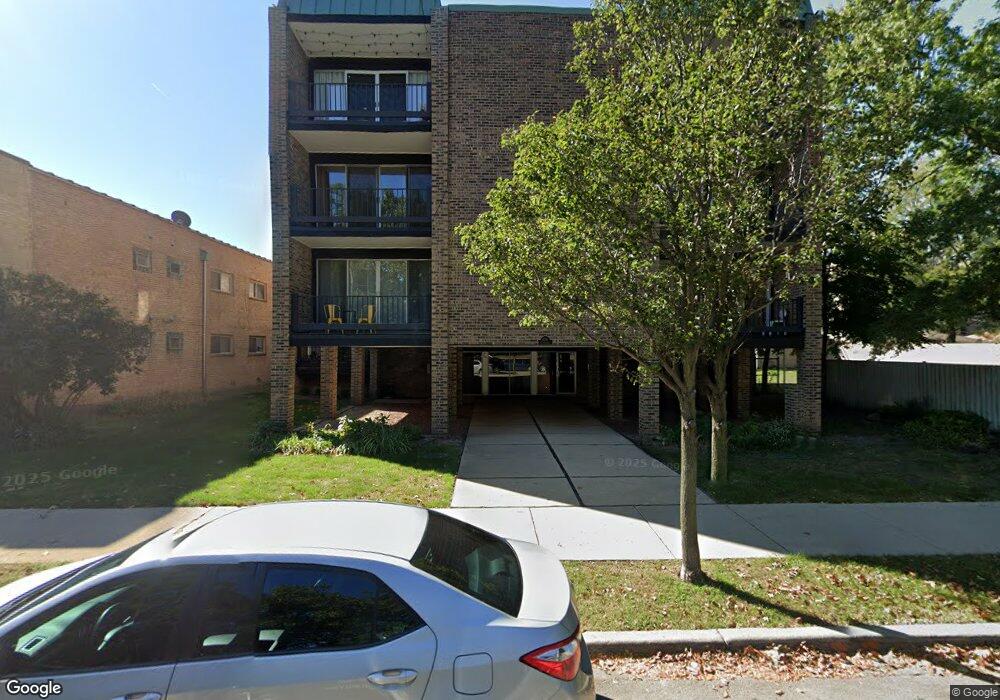
4136 N California Ave Unit 1A Chicago, IL 60618
Irving Park NeighborhoodEstimated Value: $208,000 - $302,000
1
Bed
1
Bath
825
Sq Ft
$299/Sq Ft
Est. Value
About This Home
This home is located at 4136 N California Ave Unit 1A, Chicago, IL 60618 and is currently estimated at $246,511, approximately $298 per square foot. 4136 N California Ave Unit 1A is a home located in Cook County with nearby schools including Bateman Elementary School, Roosevelt High School, and Chicago Jewish Day School.
Ownership History
Date
Name
Owned For
Owner Type
Purchase Details
Closed on
Aug 30, 2023
Sold by
Gaughan Nora
Bought by
Cauchi Raymond and Cauchi Janet
Current Estimated Value
Purchase Details
Closed on
Apr 4, 2016
Sold by
Pope Cristina and Colon Garcia Cristina L
Bought by
Gaughan Nor A K
Home Financials for this Owner
Home Financials are based on the most recent Mortgage that was taken out on this home.
Original Mortgage
$117,750
Interest Rate
3.75%
Mortgage Type
New Conventional
Purchase Details
Closed on
Nov 15, 2005
Sold by
Garcia Luis Colon
Bought by
Garcia Cristina Colon
Purchase Details
Closed on
Feb 12, 2004
Sold by
Morrison Peter
Bought by
Colon Garcia Cristina I
Home Financials for this Owner
Home Financials are based on the most recent Mortgage that was taken out on this home.
Original Mortgage
$135,000
Interest Rate
4.5%
Mortgage Type
Unknown
Create a Home Valuation Report for This Property
The Home Valuation Report is an in-depth analysis detailing your home's value as well as a comparison with similar homes in the area
Home Values in the Area
Average Home Value in this Area
Purchase History
| Date | Buyer | Sale Price | Title Company |
|---|---|---|---|
| Cauchi Raymond | $180,000 | Chicago Title | |
| Gaughan Nor A K | $157,000 | North American Title Company | |
| Garcia Cristina Colon | -- | None Available | |
| Colon Garcia Cristina I | $150,000 | Chicago Title Insurance Comp |
Source: Public Records
Mortgage History
| Date | Status | Borrower | Loan Amount |
|---|---|---|---|
| Previous Owner | Gaughan Nor A K | $117,750 | |
| Previous Owner | Colon Garcia Cristina I | $135,000 |
Source: Public Records
Tax History Compared to Growth
Tax History
| Year | Tax Paid | Tax Assessment Tax Assessment Total Assessment is a certain percentage of the fair market value that is determined by local assessors to be the total taxable value of land and additions on the property. | Land | Improvement |
|---|---|---|---|---|
| 2024 | $3,599 | $19,933 | $4,564 | $15,369 |
| 2023 | $3,509 | $17,000 | $3,681 | $13,319 |
| 2022 | $3,509 | $17,000 | $3,681 | $13,319 |
| 2021 | $3,430 | $16,999 | $3,680 | $13,319 |
| 2020 | $2,465 | $11,029 | $1,619 | $9,410 |
| 2019 | $2,476 | $12,281 | $1,619 | $10,662 |
| 2018 | $2,434 | $12,281 | $1,619 | $10,662 |
| 2017 | $2,736 | $12,669 | $1,472 | $11,197 |
| 2016 | $2,044 | $12,669 | $1,472 | $11,197 |
| 2015 | $1,847 | $12,669 | $1,472 | $11,197 |
| 2014 | $1,780 | $12,127 | $1,325 | $10,802 |
| 2013 | $1,734 | $12,127 | $1,325 | $10,802 |
Source: Public Records
Map
Nearby Homes
- 4020 N Francisco Ave
- 4251 N Mozart St Unit 2S
- 4251 N Mozart St Unit S2
- 3929 N Francisco Ave
- 2714 W Byron St
- 3908 N Mozart St
- 3024 W Irving Park Rd Unit 1S
- 4347 N Richmond St Unit 1N
- 4347 N Richmond St Unit 1S
- 4347 N Richmond St Unit 3N
- 4347 N Richmond St Unit 2N
- 3042 W Irving Park Rd
- 4015 N Albany Ave
- 4343 N Sacramento Ave Unit A-G
- 3102 W Berteau Ave Unit 31023
- 3835 N Francisco Ave
- 4018 N Albany Ave Unit GB
- 4027 N Troy St
- 4411 N Sacramento Ave Unit 1
- 2468 W Berteau Ave
- 4136 N California Ave Unit 303
- 4136 N California Ave Unit 2B
- 4136 N California Ave Unit 2A
- 4136 N California Ave Unit 3B
- 4136 N California Ave Unit 3D
- 4136 N California Ave Unit 3A
- 4136 N California Ave Unit 2D
- 4136 N California Ave Unit 3C
- 4136 N California Ave Unit 1C
- 4136 N California Ave Unit 1D
- 4136 N California Ave Unit 2C
- 4136 N California Ave Unit 1B
- 4136 N California Ave Unit 201
- 4136 N California Ave Unit 204
- 4136 N California Ave Unit 304
- 4136 N California Ave Unit 203
- 4136 N California Ave Unit 202
- 4136 N California Ave Unit 3
- 4136 N California Ave Unit 302
- 4136 N California Ave Unit 103