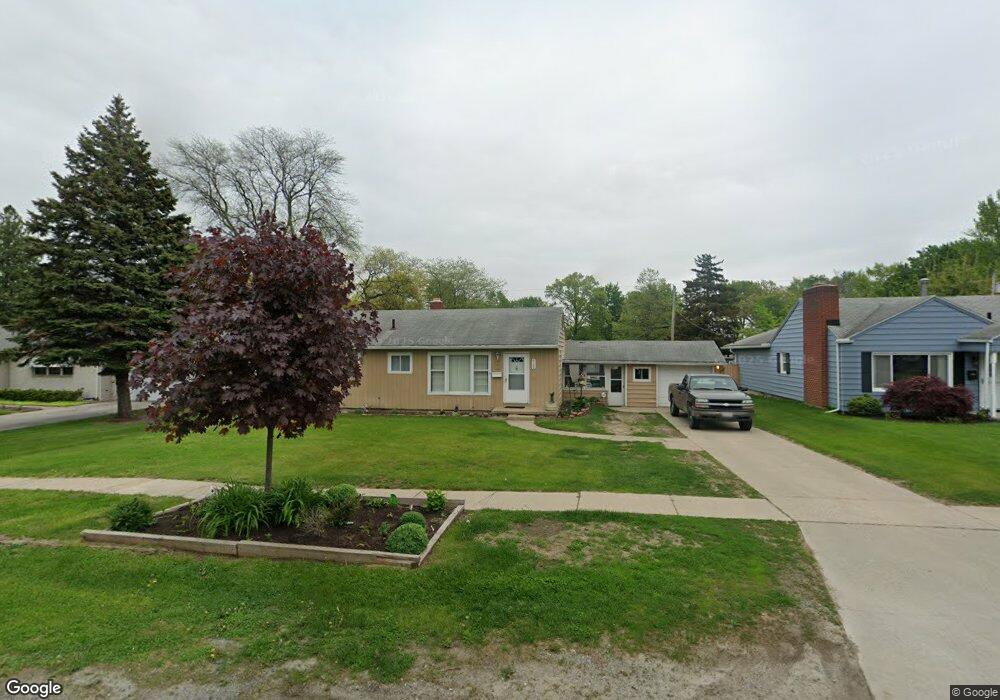
4136 Vogel Dr Toledo, OH 43613
DeVeaux NeighborhoodEstimated Value: $139,000 - $169,000
3
Beds
1
Bath
936
Sq Ft
$162/Sq Ft
Est. Value
About This Home
This home is located at 4136 Vogel Dr, Toledo, OH 43613 and is currently estimated at $151,683, approximately $162 per square foot. 4136 Vogel Dr is a home located in Lucas County with nearby schools including Hiawatha Elementary School, Jefferson Junior High School, and Washington Junior High School.
Ownership History
Date
Name
Owned For
Owner Type
Purchase Details
Closed on
Jan 9, 1998
Sold by
Stober Jeffrey M and Stober Jeffrey
Bought by
Decker John P and Decker Rose Marie
Current Estimated Value
Home Financials for this Owner
Home Financials are based on the most recent Mortgage that was taken out on this home.
Original Mortgage
$68,340
Outstanding Balance
$11,966
Interest Rate
7.24%
Mortgage Type
VA
Estimated Equity
$139,718
Purchase Details
Closed on
Sep 2, 1997
Sold by
United Companies Lending
Bought by
Stober Jeffrey
Purchase Details
Closed on
Jul 16, 1997
Sold by
Everett Brenda K
Bought by
United Companies Lending Corp
Purchase Details
Closed on
Feb 24, 1995
Sold by
Everett Brenda K
Bought by
Everett Brenda K
Home Financials for this Owner
Home Financials are based on the most recent Mortgage that was taken out on this home.
Original Mortgage
$52,500
Interest Rate
9.21%
Mortgage Type
New Conventional
Purchase Details
Closed on
Aug 27, 1993
Sold by
Everett Ozie M
Create a Home Valuation Report for This Property
The Home Valuation Report is an in-depth analysis detailing your home's value as well as a comparison with similar homes in the area
Home Values in the Area
Average Home Value in this Area
Purchase History
| Date | Buyer | Sale Price | Title Company |
|---|---|---|---|
| Decker John P | $67,000 | Northwest Title Agency Of Oh | |
| Stober Jeffrey | $41,000 | -- | |
| United Companies Lending Corp | $63,000 | -- | |
| Everett Brenda K | $63,000 | -- | |
| -- | -- | -- |
Source: Public Records
Mortgage History
| Date | Status | Borrower | Loan Amount |
|---|---|---|---|
| Open | Decker John P | $68,340 | |
| Previous Owner | Everett Brenda K | $52,500 |
Source: Public Records
Tax History Compared to Growth
Tax History
| Year | Tax Paid | Tax Assessment Tax Assessment Total Assessment is a certain percentage of the fair market value that is determined by local assessors to be the total taxable value of land and additions on the property. | Land | Improvement |
|---|---|---|---|---|
| 2024 | $1,079 | $32,970 | $7,770 | $25,200 |
| 2023 | $2,229 | $29,295 | $6,895 | $22,400 |
| 2022 | $2,205 | $29,295 | $6,895 | $22,400 |
| 2021 | $2,270 | $29,295 | $6,895 | $22,400 |
| 2020 | $2,228 | $24,395 | $5,740 | $18,655 |
| 2019 | $2,144 | $24,395 | $5,740 | $18,655 |
| 2018 | $2,058 | $24,395 | $5,740 | $18,655 |
| 2017 | $1,909 | $22,400 | $4,550 | $17,850 |
| 2016 | $1,928 | $64,000 | $13,000 | $51,000 |
| 2015 | $1,961 | $64,000 | $13,000 | $51,000 |
| 2014 | $1,526 | $22,400 | $4,550 | $17,850 |
| 2013 | $1,526 | $22,400 | $4,550 | $17,850 |
Source: Public Records
Map
Nearby Homes
- 4024 Crary Dr
- 4121 Drummond Rd
- 4211 Elmhurst Rd
- 3822 Seckinger Dr
- 3806 Doty Dr
- 3121 Gracewood Rd
- 3840 Garrison Rd
- 3805 Garrison Rd
- 4210 Bowen Rd
- 3036 Wyndale Rd
- 3647 Elmhurst Rd
- 3622 Drummond Rd
- 3823 Woodmont Rd
- 4823 Cedarhurst Rd
- 2645 Grantwood Dr
- 3748 Bowen Rd
- 3705 Lincolnshire Woods Rd
- 2728 Castleton Ave
- 3701 Lincolnshire Woods Rd
- 4807 Brott Rd