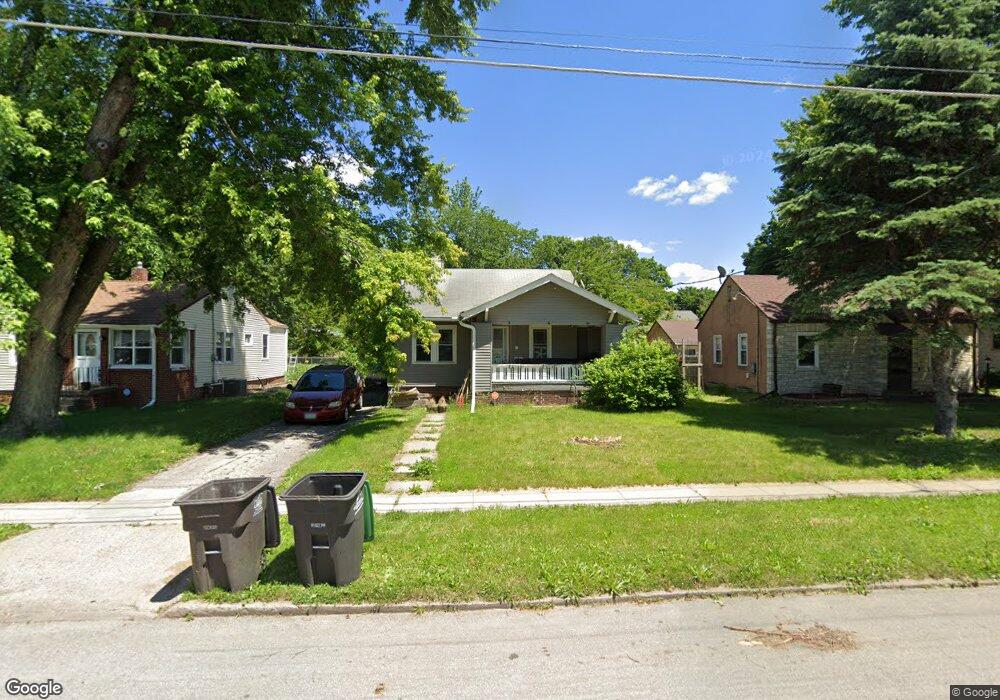
4137 4th St Des Moines, IA 50313
Highland Park NeighborhoodEstimated Value: $123,000 - $171,000
2
Beds
1
Bath
768
Sq Ft
$182/Sq Ft
Est. Value
About This Home
This home is located at 4137 4th St, Des Moines, IA 50313 and is currently estimated at $140,138, approximately $182 per square foot. 4137 4th St is a home located in Polk County with nearby schools including Oak Park Elementary School, Harding Middle School, and North High School.
Ownership History
Date
Name
Owned For
Owner Type
Purchase Details
Closed on
Jul 24, 2013
Sold by
Keller Lester
Bought by
Keller Le Roy H
Current Estimated Value
Purchase Details
Closed on
Mar 1, 2013
Sold by
Keller Lisa
Bought by
Keller Lester
Purchase Details
Closed on
Aug 31, 2011
Sold by
Alegiant Llc
Bought by
Mcelhenny Adam J
Home Financials for this Owner
Home Financials are based on the most recent Mortgage that was taken out on this home.
Original Mortgage
$63,352
Interest Rate
4.75%
Mortgage Type
FHA
Purchase Details
Closed on
Jan 6, 2011
Sold by
Poindexter Mary L
Bought by
Poindexter Mary L and Mary L Poindexter Revocable Trust
Purchase Details
Closed on
Oct 14, 2010
Sold by
Estate Of Bryan L Hauf and Freel Earl
Bought by
Alegiant L L C
Purchase Details
Closed on
Jan 8, 2004
Sold by
Poindexter Mary L
Bought by
Poindexter Mary L and Millsap Judith N
Create a Home Valuation Report for This Property
The Home Valuation Report is an in-depth analysis detailing your home's value as well as a comparison with similar homes in the area
Home Values in the Area
Average Home Value in this Area
Purchase History
| Date | Buyer | Sale Price | Title Company |
|---|---|---|---|
| Keller Le Roy H | $106,500 | None Available | |
| Keller Lester | -- | None Available | |
| Mcelhenny Adam J | $64,500 | None Available | |
| Poindexter Mary L | -- | None Available | |
| Alegiant L L C | $35,000 | None Available | |
| Poindexter Mary L | -- | -- |
Source: Public Records
Mortgage History
| Date | Status | Borrower | Loan Amount |
|---|---|---|---|
| Previous Owner | Mcelhenny Adam J | $63,352 |
Source: Public Records
Tax History
| Year | Tax Paid | Tax Assessment Tax Assessment Total Assessment is a certain percentage of the fair market value that is determined by local assessors to be the total taxable value of land and additions on the property. | Land | Improvement |
|---|---|---|---|---|
| 2025 | $1,742 | $99,000 | $28,800 | $70,200 |
| 2024 | $1,742 | $99,000 | $25,000 | $74,000 |
| 2023 | $1,746 | $99,000 | $25,000 | $74,000 |
| 2022 | $1,732 | $83,000 | $21,700 | $61,300 |
| 2021 | $1,582 | $83,000 | $21,700 | $61,300 |
| 2020 | $1,866 | $72,000 | $18,900 | $53,100 |
| 2019 | $1,698 | $72,000 | $18,900 | $53,100 |
| 2018 | $1,682 | $63,200 | $16,400 | $46,800 |
| 2017 | $1,538 | $63,200 | $16,400 | $46,800 |
| 2016 | $1,500 | $56,900 | $14,800 | $42,100 |
| 2015 | $1,500 | $56,900 | $14,800 | $42,100 |
| 2014 | $1,580 | $59,500 | $15,000 | $44,500 |
Source: Public Records
Map
Nearby Homes
- 355 NW Aurora Ave
- 4108 3rd St
- 4117 5th Ave
- 3938 1st St
- 4013 8th St
- 4013 Cambridge St
- 360 NE Aurora Ave
- 380 NE 43rd Ave
- 4120 10th St
- 921 Madison Ave
- 4012 Bowdoin St
- 3836 8th Place
- 4002 10th St
- 4290 NW 11th St
- 4012 Amherst St
- 3814 Columbia St
- 3832 Bowdoin St
- 3623 Cambridge St
- 3615 Cambridge St
- 914 Douglas Ave