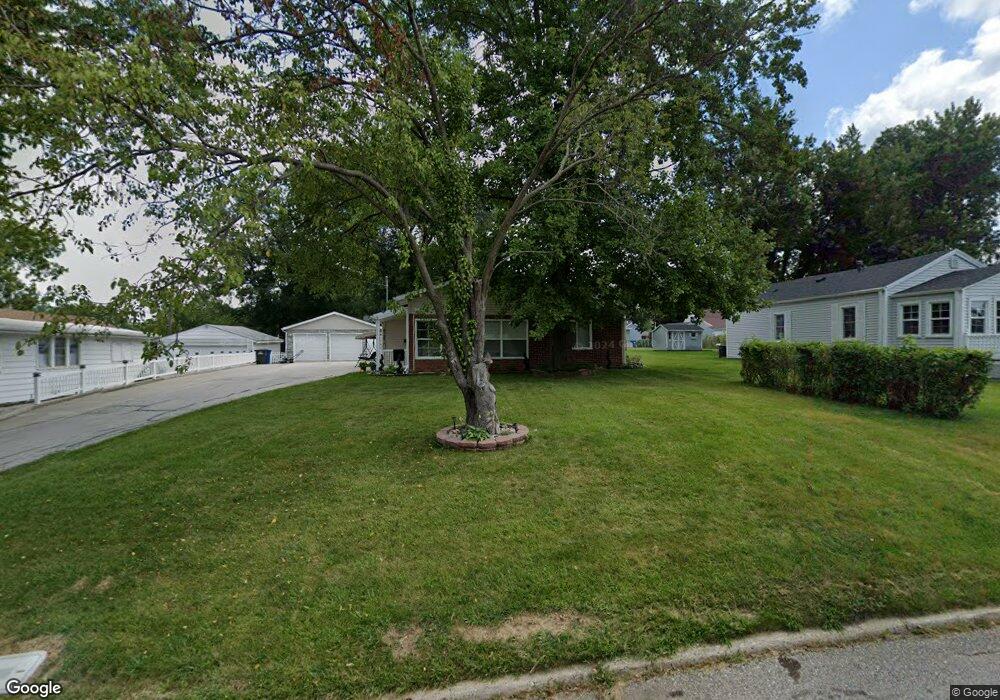
4137 56th St Des Moines, IA 50310
Merle Hay NeighborhoodEstimated Value: $192,000 - $218,510
2
Beds
1
Bath
840
Sq Ft
$248/Sq Ft
Est. Value
About This Home
This home is located at 4137 56th St, Des Moines, IA 50310 and is currently estimated at $208,128, approximately $247 per square foot. 4137 56th St is a home located in Polk County with nearby schools including Moore Elementary School, Meredith Middle School, and Hoover High School.
Ownership History
Date
Name
Owned For
Owner Type
Purchase Details
Closed on
Apr 27, 2022
Sold by
Marie Taylor Joyce
Bought by
Hyde Jacqueline L M and Taylor Robert W
Current Estimated Value
Purchase Details
Closed on
Jun 22, 2016
Sold by
Brazza Brett O
Bought by
Jeteric Remzija
Purchase Details
Closed on
Dec 4, 2011
Sold by
Patton Stephen D and Patton Connie L
Bought by
Obarza Brett
Home Financials for this Owner
Home Financials are based on the most recent Mortgage that was taken out on this home.
Original Mortgage
$73,098
Interest Rate
4.4%
Mortgage Type
FHA
Purchase Details
Closed on
Apr 20, 1999
Sold by
Mcintosh Kathern A and Mcintosh Melvin D
Bought by
Patton Stephen D and Patton Connie L
Home Financials for this Owner
Home Financials are based on the most recent Mortgage that was taken out on this home.
Original Mortgage
$62,730
Interest Rate
7.05%
Mortgage Type
VA
Create a Home Valuation Report for This Property
The Home Valuation Report is an in-depth analysis detailing your home's value as well as a comparison with similar homes in the area
Home Values in the Area
Average Home Value in this Area
Purchase History
| Date | Buyer | Sale Price | Title Company |
|---|---|---|---|
| Hyde Jacqueline L M | -- | None Listed On Document | |
| Jeteric Remzija | $78,000 | None Available | |
| Obarza Brett | $74,500 | None Available | |
| Patton Stephen D | $61,000 | -- |
Source: Public Records
Mortgage History
| Date | Status | Borrower | Loan Amount |
|---|---|---|---|
| Previous Owner | Obarza Brett | $73,098 | |
| Previous Owner | Patton Stephen D | $62,730 |
Source: Public Records
Tax History Compared to Growth
Tax History
| Year | Tax Paid | Tax Assessment Tax Assessment Total Assessment is a certain percentage of the fair market value that is determined by local assessors to be the total taxable value of land and additions on the property. | Land | Improvement |
|---|---|---|---|---|
| 2025 | $2,412 | $209,500 | $49,700 | $159,800 |
| 2024 | $2,412 | $148,000 | $43,300 | $104,700 |
| 2023 | $2,318 | $184,700 | $43,300 | $141,400 |
| 2022 | $2,296 | $156,200 | $38,000 | $118,200 |
| 2021 | $2,236 | $156,200 | $38,000 | $118,200 |
| 2020 | $1,844 | $146,400 | $35,500 | $110,900 |
| 2019 | $2,198 | $146,400 | $35,500 | $110,900 |
| 2018 | $2,402 | $127,000 | $31,100 | $95,900 |
| 2017 | $2,632 | $90,300 | $31,100 | $59,200 |
| 2016 | $2,564 | $97,300 | $27,800 | $69,500 |
| 2015 | $2,564 | $97,300 | $27,800 | $69,500 |
| 2014 | $2,344 | $88,200 | $24,700 | $63,500 |
Source: Public Records
Map
Nearby Homes
- 4149 56th St
- 4131 55th St
- 4120 57th St
- 3922 56th St
- 3924 54th St
- 3925 55th St
- 4115 51st St
- 3929 53rd St
- 3912 53rd St
- 3901 54th St
- 3906 53rd St
- 4034 50th St
- 3940 51st St
- 3841 55th St
- 5118 Bel Aire Rd Unit 5118
- 4211 62nd St Unit 1
- 4213 62nd St Unit 2
- 4212 62nd St Unit 5
- 3826 53rd St
- 4200 62nd St Unit 2