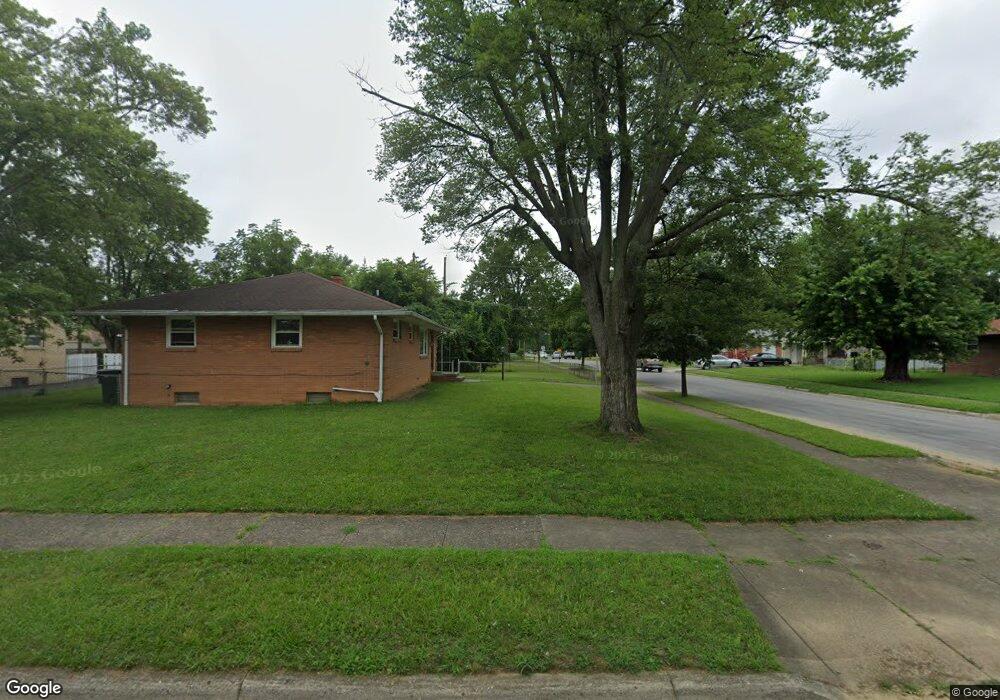
4137 Astor Ave Columbus, OH 43227
Beechwood NeighborhoodEstimated Value: $179,541 - $245,000
4
Beds
2
Baths
1,053
Sq Ft
$206/Sq Ft
Est. Value
About This Home
This home is located at 4137 Astor Ave, Columbus, OH 43227 and is currently estimated at $216,885, approximately $205 per square foot. 4137 Astor Ave is a home located in Franklin County with nearby schools including Shady Lane Elementary School, Sherwood Middle School, and Walnut Ridge High School.
Ownership History
Date
Name
Owned For
Owner Type
Purchase Details
Closed on
Feb 11, 2000
Sold by
Johnson Delphena A
Bought by
Jones Henry L
Current Estimated Value
Home Financials for this Owner
Home Financials are based on the most recent Mortgage that was taken out on this home.
Original Mortgage
$100,818
Outstanding Balance
$31,022
Interest Rate
8.08%
Mortgage Type
FHA
Estimated Equity
$185,863
Purchase Details
Closed on
Sep 24, 1999
Sold by
Jewett Ronald T
Bought by
Johnson Delphena A
Home Financials for this Owner
Home Financials are based on the most recent Mortgage that was taken out on this home.
Original Mortgage
$59,900
Interest Rate
8.21%
Purchase Details
Closed on
Jul 28, 1998
Sold by
Jewett Barbara J
Bought by
Jewett Ronald T
Purchase Details
Closed on
Jan 1, 1980
Create a Home Valuation Report for This Property
The Home Valuation Report is an in-depth analysis detailing your home's value as well as a comparison with similar homes in the area
Home Values in the Area
Average Home Value in this Area
Purchase History
| Date | Buyer | Sale Price | Title Company |
|---|---|---|---|
| Jones Henry L | $100,900 | Lawyers Title | |
| Johnson Delphena A | $86,900 | Foundation Title Agency Inc | |
| Jewett Ronald T | -- | -- | |
| -- | $46,000 | -- |
Source: Public Records
Mortgage History
| Date | Status | Borrower | Loan Amount |
|---|---|---|---|
| Open | Jones Henry L | $100,818 | |
| Previous Owner | Johnson Delphena A | $59,900 |
Source: Public Records
Tax History
| Year | Tax Paid | Tax Assessment Tax Assessment Total Assessment is a certain percentage of the fair market value that is determined by local assessors to be the total taxable value of land and additions on the property. | Land | Improvement |
|---|---|---|---|---|
| 2025 | $3,150 | $70,180 | $15,330 | $54,850 |
| 2024 | $3,150 | $70,180 | $15,330 | $54,850 |
| 2023 | $3,109 | $70,175 | $15,330 | $54,845 |
| 2022 | $2,090 | $40,290 | $7,350 | $32,940 |
| 2021 | $2,093 | $40,290 | $7,350 | $32,940 |
| 2020 | $2,096 | $40,290 | $7,350 | $32,940 |
| 2019 | $1,939 | $31,960 | $5,880 | $26,080 |
| 2018 | $1,815 | $31,960 | $5,880 | $26,080 |
| 2017 | $1,938 | $31,960 | $5,880 | $26,080 |
| 2016 | $1,867 | $28,180 | $5,780 | $22,400 |
| 2015 | $1,695 | $28,180 | $5,780 | $22,400 |
| 2014 | $1,699 | $28,180 | $5,780 | $22,400 |
| 2013 | $986 | $33,145 | $6,790 | $26,355 |
Source: Public Records
Map
Nearby Homes
- 1275 Elaine Rd
- 3990 Astor Ave
- 4024 Colby Ave
- 1301 Bernhard Rd
- 1265 Elderwood Ave
- 3955 E Fulton St
- 1294 Dellwood Ave
- 957 Rose Place
- 963 Erickson Ave
- 1469 Burlington Ave
- 1490 Elaine Rd Unit 1462
- 1269 Carolwood Ave
- 1492 Burlington Ave
- 1281 Maetzel Dr
- 1035 E Fulton St
- 1001 Beechwood Rd
- 931 E Fulton St
- 1085 S Hamilton Rd
- 4467 Grimsby Rd
- 1284 Thurston Dr
- 1217 Elaine Rd
- 1202 S Yearling Rd
- 4140 Astor Ave
- 1225 Elaine Rd
- 1210 S Yearling Rd
- 4159 Astor Ave
- 4120 Astor Ave
- 1218 S Yearling Rd
- 1220 Elaine Rd
- 1185 Elaine Rd
- 1233 Elaine Rd
- 4160 Astor Ave
- 1226 S Yearling Rd
- 1180 S Yearling Rd
- 1236 Elaine Rd
- 1241 Elaine Rd
- 1177 Elaine Rd
- 1188 Elaine Rd
- 1234 S Yearling Rd
- 1172 S Yearling Rd
Your Personal Tour Guide
Ask me questions while you tour the home.