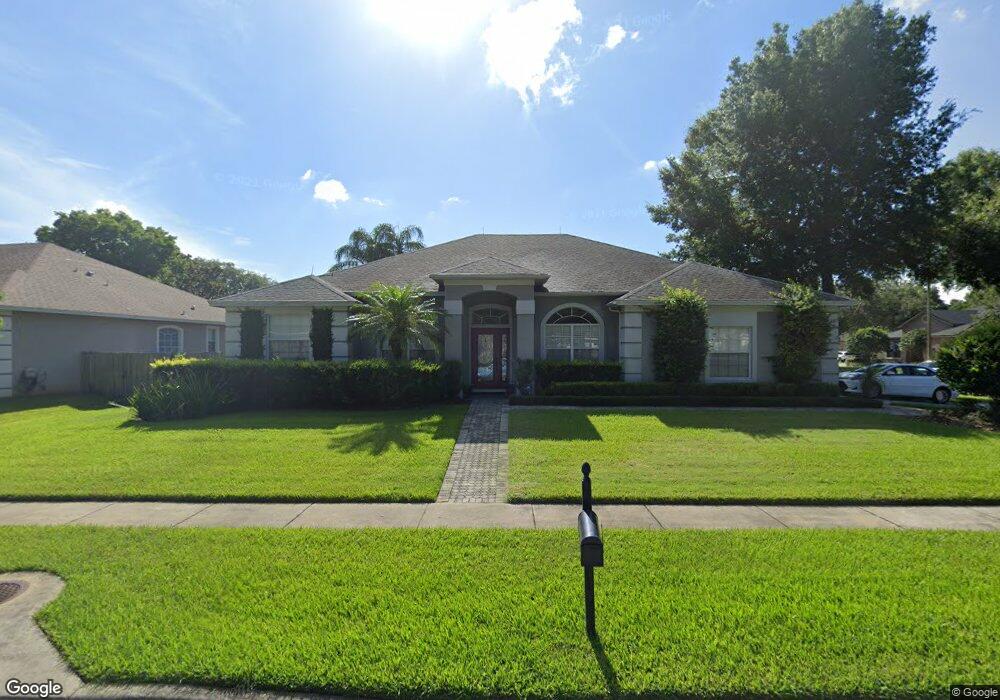
4137 Bounce Dr Orlando, FL 32812
Conway NeighborhoodEstimated Value: $524,997 - $611,000
4
Beds
3
Baths
2,348
Sq Ft
$241/Sq Ft
Est. Value
About This Home
This home is located at 4137 Bounce Dr, Orlando, FL 32812 and is currently estimated at $564,749, approximately $240 per square foot. 4137 Bounce Dr is a home located in Orange County with nearby schools including Shenandoah Elementary School, Conway Middle School, and Boone High School.
Ownership History
Date
Name
Owned For
Owner Type
Purchase Details
Closed on
Jul 14, 2014
Sold by
Oliver Joseph M
Bought by
Pizzo Sean L
Current Estimated Value
Home Financials for this Owner
Home Financials are based on the most recent Mortgage that was taken out on this home.
Original Mortgage
$70,000
Outstanding Balance
$53,379
Interest Rate
4.19%
Mortgage Type
New Conventional
Estimated Equity
$511,370
Purchase Details
Closed on
May 11, 2006
Sold by
Valdes William H
Bought by
Oliver Joseph M and Oliver Kimberly D
Purchase Details
Closed on
Oct 28, 2005
Sold by
Abraham Nasser and Abraham Sandra
Bought by
Oliver Joseph and Oliver Kimberly
Purchase Details
Closed on
Jan 4, 1999
Sold by
Engle Homes/Orlando Inc
Bought by
Abraham Nasser and Abraham Sandra
Home Financials for this Owner
Home Financials are based on the most recent Mortgage that was taken out on this home.
Original Mortgage
$130,290
Interest Rate
6.87%
Mortgage Type
New Conventional
Create a Home Valuation Report for This Property
The Home Valuation Report is an in-depth analysis detailing your home's value as well as a comparison with similar homes in the area
Home Values in the Area
Average Home Value in this Area
Purchase History
| Date | Buyer | Sale Price | Title Company |
|---|---|---|---|
| Pizzo Sean L | $95,000 | Clear Title Of Florida Llc | |
| Oliver Joseph M | -- | Attorney | |
| Oliver Joseph | $375,400 | Sunbelt Title Agency | |
| Abraham Nasser | $173,800 | -- |
Source: Public Records
Mortgage History
| Date | Status | Borrower | Loan Amount |
|---|---|---|---|
| Open | Pizzo Sean L | $70,000 | |
| Previous Owner | Abraham Nasser | $130,290 |
Source: Public Records
Tax History
| Year | Tax Paid | Tax Assessment Tax Assessment Total Assessment is a certain percentage of the fair market value that is determined by local assessors to be the total taxable value of land and additions on the property. | Land | Improvement |
|---|---|---|---|---|
| 2025 | $4,482 | $291,857 | -- | -- |
| 2024 | $3,962 | $283,632 | -- | -- |
| 2023 | $3,962 | $267,610 | $0 | $0 |
| 2022 | $3,813 | $259,816 | $0 | $0 |
| 2021 | $3,753 | $252,249 | $0 | $0 |
| 2020 | $3,579 | $248,766 | $0 | $0 |
| 2019 | $3,675 | $243,173 | $0 | $0 |
| 2018 | $3,645 | $238,639 | $0 | $0 |
| 2017 | $3,585 | $246,686 | $50,000 | $196,686 |
| 2016 | $3,556 | $240,832 | $50,000 | $190,832 |
| 2015 | $3,613 | $227,333 | $50,000 | $177,333 |
| 2014 | $4,119 | $213,270 | $55,000 | $158,270 |
Source: Public Records
Map
Nearby Homes
- 4220 Lillian Hall Ln
- 4301 Hurd Ave
- 4030 Evander Dr
- 1935 Conway Landing Dr Unit 5
- 4598 Conway Landing Dr
- 4655 Sturbridge Cir
- 4490 Simmons Rd
- 3845 Landlubber St
- 4626 Sturbridge Ct
- 4623 Wydham Ln
- 4791 Deer Rd
- 5348 Tribune Dr
- 5407 Conway Oaks Ct
- 5684 Abercorn Dr
- 4210 Stonewall Dr
- 4623 Ternstone Ave
- 4231 Inwood Landing Dr
- 3336 Herringridge Dr
- 4822 S Conway Rd Unit 127
- 4822 S Conway Rd Unit 125
- 4131 Bounce Dr
- 4124 Lillian Hall Ln
- 4118 Lillian Hall Ln
- 4163 Evander Dr
- 4174 Evander Dr
- 4127 Bounce Dr
- 4180 Evander Dr
- 4168 Evander Dr
- 4132 Bounce Dr
- 4112 Lillian Hall Ln
- 4162 Evander Dr
- 4157 Evander Dr
- 4126 Bounce Dr
- 4121 Bounce Dr
- 4106 Lillian Hall Ln
- 4208 Lillian Hall Ln
- 4129 Lillian Hall Ln
- 4123 Lillian Hall Ln
- 4156 Evander Dr
- 4709 Seils Way
Your Personal Tour Guide
Ask me questions while you tour the home.