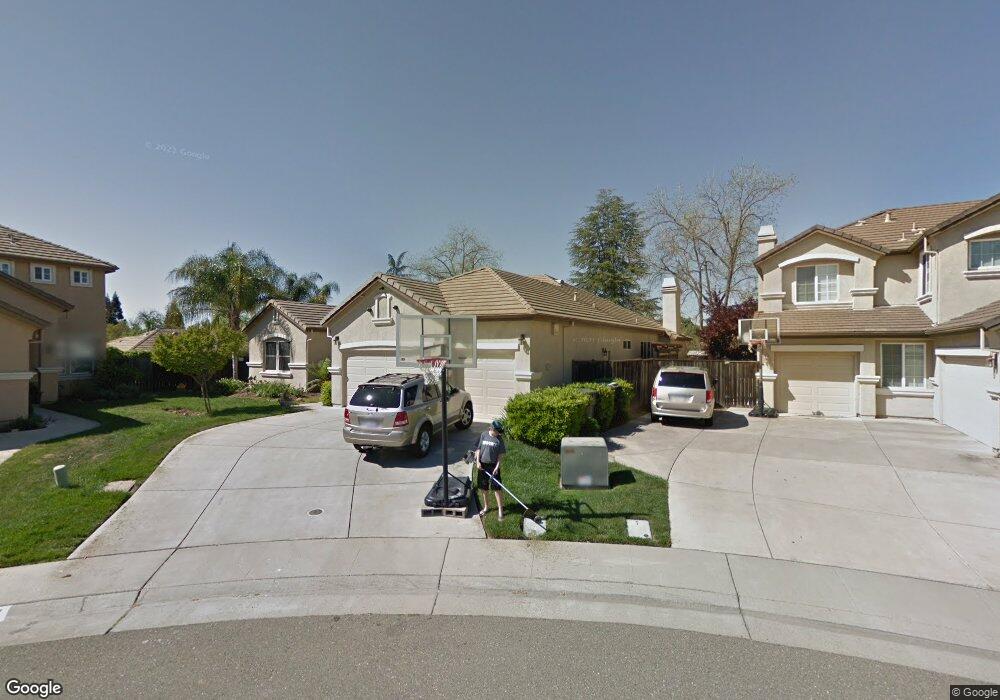
4137 Poppleton Way Carmichael, CA 95608
Estimated Value: $771,000 - $825,000
4
Beds
3
Baths
2,700
Sq Ft
$293/Sq Ft
Est. Value
About This Home
This home is located at 4137 Poppleton Way, Carmichael, CA 95608 and is currently estimated at $790,456, approximately $292 per square foot. 4137 Poppleton Way is a home located in Sacramento County with nearby schools including Albert Schweitzer Elementary School, John Barrett Middle School, and Del Campo High School.
Ownership History
Date
Name
Owned For
Owner Type
Purchase Details
Closed on
Jul 31, 2012
Sold by
Cooper Loren B and Cooper Ingrid Z
Bought by
Cooper Loren B and Cooper Ingrid Z
Current Estimated Value
Home Financials for this Owner
Home Financials are based on the most recent Mortgage that was taken out on this home.
Original Mortgage
$161,500
Interest Rate
3.62%
Mortgage Type
New Conventional
Purchase Details
Closed on
Jun 10, 2008
Sold by
Cooper Ingrid Z and Cooper Loren Brian
Bought by
Cooper Loren B and Cooper Ingrid Z
Purchase Details
Closed on
Nov 6, 2001
Sold by
Borge Development Inc
Bought by
Cooper Ingrid Z and Cooper Loren Brian
Home Financials for this Owner
Home Financials are based on the most recent Mortgage that was taken out on this home.
Original Mortgage
$240,000
Interest Rate
6.73%
Create a Home Valuation Report for This Property
The Home Valuation Report is an in-depth analysis detailing your home's value as well as a comparison with similar homes in the area
Home Values in the Area
Average Home Value in this Area
Purchase History
| Date | Buyer | Sale Price | Title Company |
|---|---|---|---|
| Cooper Loren B | -- | Old Republic Title Company | |
| Cooper Loren B | -- | Enold Republic Title Company | |
| Cooper Loren B | -- | None Available | |
| Cooper Ingrid Z | $380,000 | Stewart Title |
Source: Public Records
Mortgage History
| Date | Status | Borrower | Loan Amount |
|---|---|---|---|
| Closed | Cooper Loren B | $161,500 | |
| Closed | Cooper Ingrid Z | $240,000 |
Source: Public Records
Tax History
| Year | Tax Paid | Tax Assessment Tax Assessment Total Assessment is a certain percentage of the fair market value that is determined by local assessors to be the total taxable value of land and additions on the property. | Land | Improvement |
|---|---|---|---|---|
| 2025 | $7,000 | $596,824 | $138,854 | $457,970 |
| 2024 | $7,000 | $585,123 | $136,132 | $448,991 |
| 2023 | $6,888 | $573,651 | $133,463 | $440,188 |
| 2022 | $6,749 | $562,404 | $130,847 | $431,557 |
| 2021 | $6,636 | $551,378 | $128,282 | $423,096 |
| 2020 | $6,511 | $545,725 | $126,967 | $418,758 |
| 2019 | $6,379 | $535,026 | $124,478 | $410,548 |
| 2018 | $6,304 | $524,537 | $122,038 | $402,499 |
| 2017 | $5,860 | $483,124 | $114,528 | $368,596 |
| 2016 | $5,314 | $460,119 | $109,075 | $351,044 |
| 2015 | $5,142 | $442,423 | $104,880 | $337,543 |
| 2014 | $4,985 | $429,537 | $101,825 | $327,712 |
Source: Public Records
Map
Nearby Homes
- 4204 Abraham Way
- 4072 Porton Ln
- 8213 Caminata Ln
- 4085 Porton Ln
- 4089 Porton Ln
- 4027 Porton Ln
- 4093 Porton Ln
- 4023 Porton Ln
- 4097 Porton Ln
- 4019 Porton Ln
- 4015 Porton Ln
- 4072 Alex Ln
- 4243 Glenridge Dr
- 4112 Alex Ln
- 6730 Lakeview Dr
- 4434 Mapel Ln
- 3745 Marshall Ave
- 3900 Park Circle Ln Unit B
- 4009 Fairwood Way
- 6420 Quiescence Ln Unit C
- 4133 Poppleton Way
- 4141 Poppleton Way
- 4022 Poppleton Way
- 6742 Lincoln Ave
- 4026 Poppleton Way
- 4129 Poppleton Way
- 4145 Poppleton Way
- 4030 Poppleton Way
- 4128 Poppleton Way
- 4125 Poppleton Way
- 6744 Lincoln Ave
- 4149 Poppleton Way
- 4034 Poppleton Way
- 4124 Poppleton Way
- 4025 Poppleton Way
- 6820 Lincoln Ave
- 6738 Lincoln Ave
- 4029 Poppleton Way
- 4121 Poppleton Way
- 6740 Lincoln Ave
Your Personal Tour Guide
Ask me questions while you tour the home.