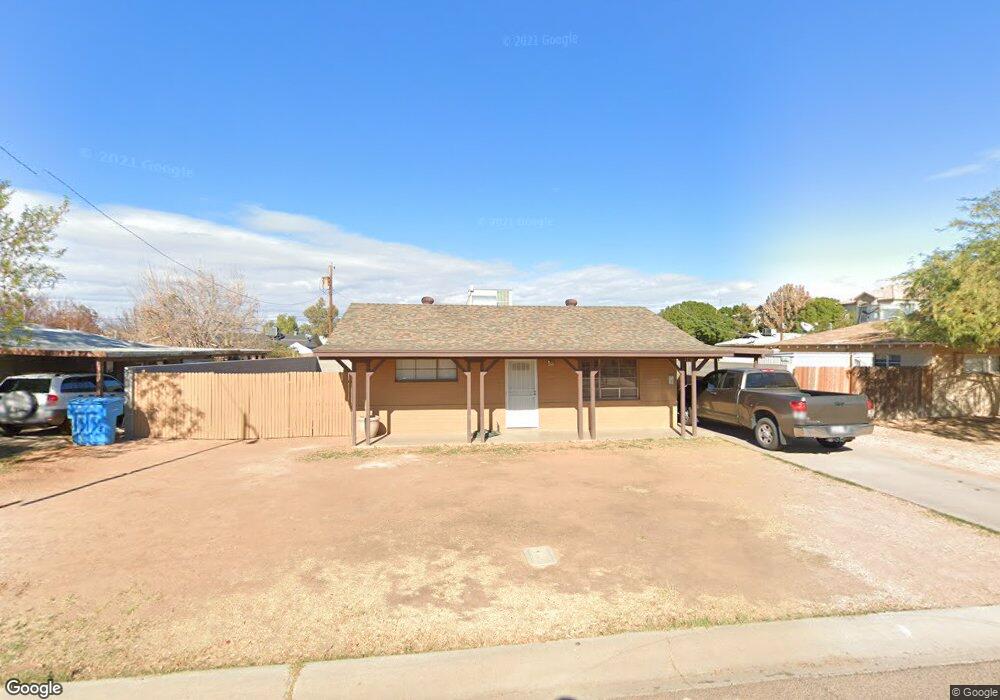
4138 E Pierce St Phoenix, AZ 85008
Camelback East Village NeighborhoodEstimated Value: $269,459 - $300,000
2
Beds
1
Bath
800
Sq Ft
$358/Sq Ft
Est. Value
About This Home
This home is located at 4138 E Pierce St, Phoenix, AZ 85008 and is currently estimated at $286,365, approximately $357 per square foot. 4138 E Pierce St is a home located in Maricopa County with nearby schools including David Crockett School, Camelback High School, and Phoenix Coding Academy.
Ownership History
Date
Name
Owned For
Owner Type
Purchase Details
Closed on
May 31, 2001
Sold by
Warner David
Bought by
Castaneda Ramiro
Current Estimated Value
Home Financials for this Owner
Home Financials are based on the most recent Mortgage that was taken out on this home.
Original Mortgage
$84,247
Outstanding Balance
$32,115
Interest Rate
7.15%
Mortgage Type
FHA
Estimated Equity
$254,250
Purchase Details
Closed on
Mar 28, 2001
Sold by
Warner Jing
Bought by
Warner David
Home Financials for this Owner
Home Financials are based on the most recent Mortgage that was taken out on this home.
Original Mortgage
$51,200
Interest Rate
7.11%
Mortgage Type
New Conventional
Purchase Details
Closed on
Mar 13, 2001
Sold by
Thomas Theresa Kay
Bought by
Furcini Properties Inc
Home Financials for this Owner
Home Financials are based on the most recent Mortgage that was taken out on this home.
Original Mortgage
$51,200
Interest Rate
7.11%
Mortgage Type
New Conventional
Create a Home Valuation Report for This Property
The Home Valuation Report is an in-depth analysis detailing your home's value as well as a comparison with similar homes in the area
Home Values in the Area
Average Home Value in this Area
Purchase History
| Date | Buyer | Sale Price | Title Company |
|---|---|---|---|
| Castaneda Ramiro | $85,000 | American Title Insurance | |
| Warner David | -- | Stewart Title & Trust | |
| Warner David | $66,500 | Stewart Title & Trust | |
| Furcini Properties Inc | $55,000 | Stewart Title & Trust |
Source: Public Records
Mortgage History
| Date | Status | Borrower | Loan Amount |
|---|---|---|---|
| Open | Castaneda Ramiro | $84,247 | |
| Previous Owner | Furcini Properties Inc | $51,200 |
Source: Public Records
Tax History
| Year | Tax Paid | Tax Assessment Tax Assessment Total Assessment is a certain percentage of the fair market value that is determined by local assessors to be the total taxable value of land and additions on the property. | Land | Improvement |
|---|---|---|---|---|
| 2025 | $1,022 | $9,128 | -- | -- |
| 2024 | $949 | $8,693 | -- | -- |
| 2023 | $949 | $20,870 | $4,170 | $16,700 |
| 2022 | $912 | $13,850 | $2,770 | $11,080 |
| 2021 | $939 | $13,220 | $2,640 | $10,580 |
| 2020 | $921 | $12,420 | $2,480 | $9,940 |
| 2019 | $919 | $9,460 | $1,890 | $7,570 |
| 2018 | $482 | $7,720 | $1,540 | $6,180 |
| 2017 | $460 | $5,470 | $1,090 | $4,380 |
| 2016 | $450 | $4,850 | $970 | $3,880 |
| 2015 | $424 | $3,880 | $770 | $3,110 |
Source: Public Records
Map
Nearby Homes
- 3743 E Taylor St
- 3722 E Taylor St
- 313 N 47th St
- 1225 N 36th St Unit 1042
- 1225 N 36th St Unit 2011
- 1225 N 36th St Unit 2081
- 1225 N 36th St Unit 1090
- 4002 E Mcdowell Rd
- 4728 E Belleview St
- 4733 E Belleview St Unit 44
- 2725 E Mcdowell Rd Unit 13
- 2729 E Mcdowell Rd Unit 15
- 4756 E Moreland St Unit 35
- 4759 E Belleview St Unit 60
- 1723 N 42nd St
- 4211 E Palm Ln Unit 208
- 4437 E Almeria Rd
- 1241 N 48th St Unit 106
- 1241 N 48th St Unit 102
- 1241 N 48th St Unit 114
- 4132 E Pierce St
- 4142 E Pierce St
- 4137 E Mckinley St
- 4141 E Mckinley St Unit 2
- 4141 E Mckinley St
- 4131 E Mckinley St
- 4128 E Pierce St
- 4148 E Pierce St
- 4137 E Pierce St
- 4147 E Mckinley St
- 4127 E Mckinley St
- 4131 E Pierce St
- 4141 E Pierce St
- 4122 E Pierce St
- 4127 E Pierce St
- 4147 E Pierce St
- 4121 E Mckinley St
- 4121 E Pierce St
- 4118 E Pierce St
- 4138 E Mckinley St
Your Personal Tour Guide
Ask me questions while you tour the home.