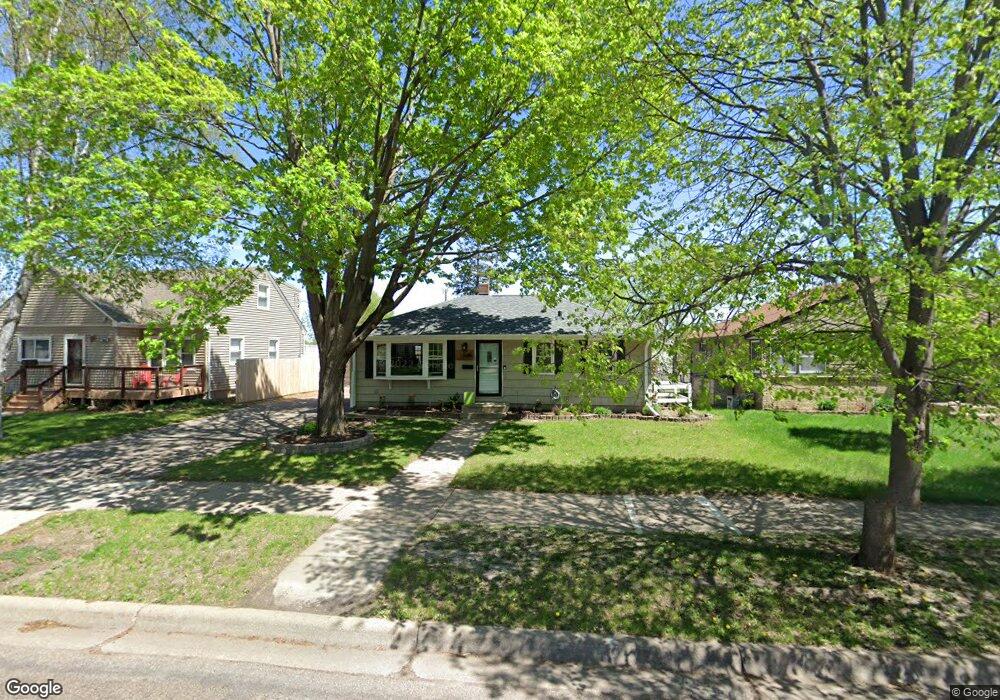
414 18th Ave N South Saint Paul, MN 55075
Estimated Value: $305,000 - $314,000
4
Beds
2
Baths
1,743
Sq Ft
$178/Sq Ft
Est. Value
About This Home
This home is located at 414 18th Ave N, South Saint Paul, MN 55075 and is currently estimated at $309,757, approximately $177 per square foot. 414 18th Ave N is a home located in Dakota County with nearby schools including Lincoln Center Elementary, South St. Paul Secondary, and Academic Arts High School.
Ownership History
Date
Name
Owned For
Owner Type
Purchase Details
Closed on
Sep 2, 2021
Sold by
Malak Joseph G and Malak Megan
Bought by
Comer Timothy P and Rohland Amy E
Current Estimated Value
Home Financials for this Owner
Home Financials are based on the most recent Mortgage that was taken out on this home.
Original Mortgage
$273,540
Outstanding Balance
$248,530
Interest Rate
2.7%
Mortgage Type
New Conventional
Estimated Equity
$61,227
Purchase Details
Closed on
Jun 18, 2018
Sold by
Schaefer Jacyn and Schaefer Jaclyn
Bought by
Malak Joseph G and Malak Megan
Home Financials for this Owner
Home Financials are based on the most recent Mortgage that was taken out on this home.
Original Mortgage
$235,554
Interest Rate
4.75%
Mortgage Type
FHA
Purchase Details
Closed on
Jun 17, 2010
Sold by
Lagoo Kerri L Nadean and Lagoo Jeff
Bought by
Auge Jaclyn R and Schaefer John
Purchase Details
Closed on
Jun 15, 2001
Sold by
Kopp Brian L and Kopp Linda M
Bought by
Nadeau Kerri L
Create a Home Valuation Report for This Property
The Home Valuation Report is an in-depth analysis detailing your home's value as well as a comparison with similar homes in the area
Home Values in the Area
Average Home Value in this Area
Purchase History
| Date | Buyer | Sale Price | Title Company |
|---|---|---|---|
| Comer Timothy P | $282,000 | Burnet Title | |
| Malak Joseph G | $239,900 | Titlesmart Inc | |
| Auge Jaclyn R | $178,000 | -- | |
| Nadeau Kerri L | $154,900 | -- | |
| Comer Timothy Timothy | $282,000 | -- |
Source: Public Records
Mortgage History
| Date | Status | Borrower | Loan Amount |
|---|---|---|---|
| Open | Comer Timothy P | $273,540 | |
| Previous Owner | Malak Joseph G | $235,554 | |
| Closed | Comer Timothy Timothy | $273,540 |
Source: Public Records
Tax History Compared to Growth
Tax History
| Year | Tax Paid | Tax Assessment Tax Assessment Total Assessment is a certain percentage of the fair market value that is determined by local assessors to be the total taxable value of land and additions on the property. | Land | Improvement |
|---|---|---|---|---|
| 2024 | $3,304 | $251,100 | $77,800 | $173,300 |
| 2023 | $3,304 | $238,300 | $78,300 | $160,000 |
| 2022 | $2,606 | $239,700 | $78,200 | $161,500 |
| 2021 | $2,580 | $203,600 | $68,000 | $135,600 |
| 2020 | $2,418 | $198,400 | $64,800 | $133,600 |
| 2019 | $2,280 | $191,900 | $61,700 | $130,200 |
| 2018 | $2,178 | $175,700 | $56,100 | $119,600 |
| 2017 | $1,893 | $163,000 | $53,400 | $109,600 |
| 2016 | $1,869 | $148,500 | $48,600 | $99,900 |
| 2015 | $1,839 | $117,322 | $38,308 | $79,014 |
| 2014 | -- | $122,554 | $38,706 | $83,848 |
| 2013 | -- | $107,294 | $32,933 | $74,361 |
Source: Public Records
Map
Nearby Homes
- 436 17th Ave N
- 425 16th Ave N
- 522 16th Ave N
- 2205 Acorn Ln
- 1200 Dwane St
- 352 12th Ave N
- 606 13th Ave N
- 114 20th Ave N
- 601 Levander Way Unit 101
- 601 Levander Way Unit 208
- 127 16th Ave S
- 916 4th St N
- 212 11th Ave N
- 119 22nd Ave S
- 818 16th Ave N
- 152 21st Ave S
- 101 11th Ave N
- 210 19th Ave S
- 217 20th Ave S
- 119 10th Ave N
- 414 414 18th Ave N
- 420 18th Ave N
- 408 18th Ave N
- 426 18th Ave N
- 402 18th Ave N
- 415 17th Ave N
- 421 17th Ave N
- 409 17th Ave N
- 427 17th Ave N
- 432 18th Ave N
- 403 17th Ave N
- 403 403 17th Ave N
- 432 18th Ave N
- 415 18th Ave N
- 409 18th Ave N
- 421 18th Ave N
- 427 427 18th-Avenue-n
- 433 17th Ave N
- 403 18th Ave N
- 427 18th Ave N