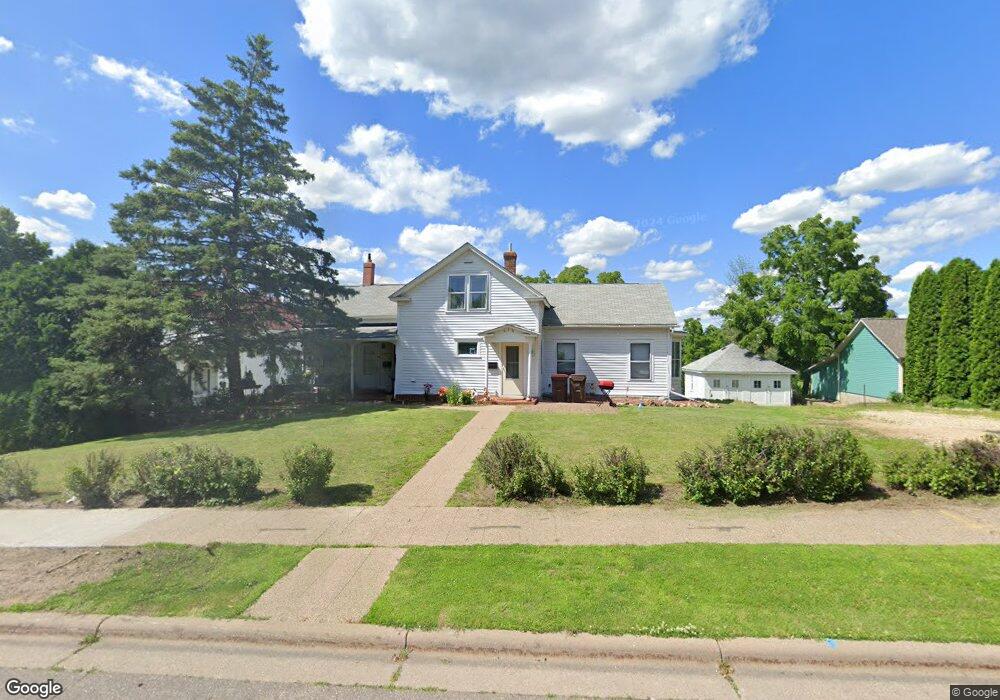
414 2nd St W Hastings, MN 55033
Hastings-Marshan Township NeighborhoodEstimated Value: $325,319 - $380,000
2
Beds
3
Baths
1,773
Sq Ft
$200/Sq Ft
Est. Value
About This Home
This home is located at 414 2nd St W, Hastings, MN 55033 and is currently estimated at $354,830, approximately $200 per square foot. 414 2nd St W is a home located in Dakota County with nearby schools including Hastings Middle School, Christa Mcauliffe Elementary School, and Hastings High School.
Ownership History
Date
Name
Owned For
Owner Type
Purchase Details
Closed on
Jun 3, 2019
Sold by
Duong Cuong Kim and Duong Lori Anne
Bought by
Ramsey Homes Llc
Current Estimated Value
Purchase Details
Closed on
Jul 28, 1998
Sold by
Ibi Inc
Bought by
Hastings Midtown Llc
Purchase Details
Closed on
Oct 1, 1996
Sold by
Wisness Osmund A
Bought by
Duong Cuons Kim and Duong Lori Anne
Create a Home Valuation Report for This Property
The Home Valuation Report is an in-depth analysis detailing your home's value as well as a comparison with similar homes in the area
Home Values in the Area
Average Home Value in this Area
Purchase History
| Date | Buyer | Sale Price | Title Company |
|---|---|---|---|
| Ramsey Homes Llc | -- | None Available | |
| Hastings Midtown Llc | $2,750,000 | -- | |
| Duong Cuons Kim | $69,000 | -- | |
| Duong Cuong Kim | $69,000 | -- |
Source: Public Records
Mortgage History
| Date | Status | Borrower | Loan Amount |
|---|---|---|---|
| Closed | Duong Cuong Kim | -- |
Source: Public Records
Tax History Compared to Growth
Tax History
| Year | Tax Paid | Tax Assessment Tax Assessment Total Assessment is a certain percentage of the fair market value that is determined by local assessors to be the total taxable value of land and additions on the property. | Land | Improvement |
|---|---|---|---|---|
| 2024 | $4,376 | $311,500 | $106,300 | $205,200 |
| 2023 | $4,008 | $314,600 | $106,400 | $208,200 |
| 2022 | $3,756 | $297,400 | $106,200 | $191,200 |
| 2021 | $3,636 | $253,200 | $92,300 | $160,900 |
| 2020 | $3,762 | $243,500 | $87,900 | $155,600 |
| 2019 | $3,493 | $243,800 | $83,800 | $160,000 |
| 2018 | $3,343 | $215,100 | $79,800 | $135,300 |
| 2017 | $2,981 | $198,800 | $76,000 | $122,800 |
| 2016 | $3,056 | $175,600 | $71,000 | $104,600 |
| 2015 | $3,056 | $175,600 | $68,900 | $106,700 |
| 2014 | $2,964 | $171,100 | $66,400 | $104,700 |
| 2013 | $2,766 | $149,800 | $60,100 | $89,700 |
Source: Public Records
Map
Nearby Homes