O
Landlord's Agent in 2024
Owen Leggio
Leggio Realty Group
16 in this area
21 Total Sales
Estimated Value: $361,561 - $469,000
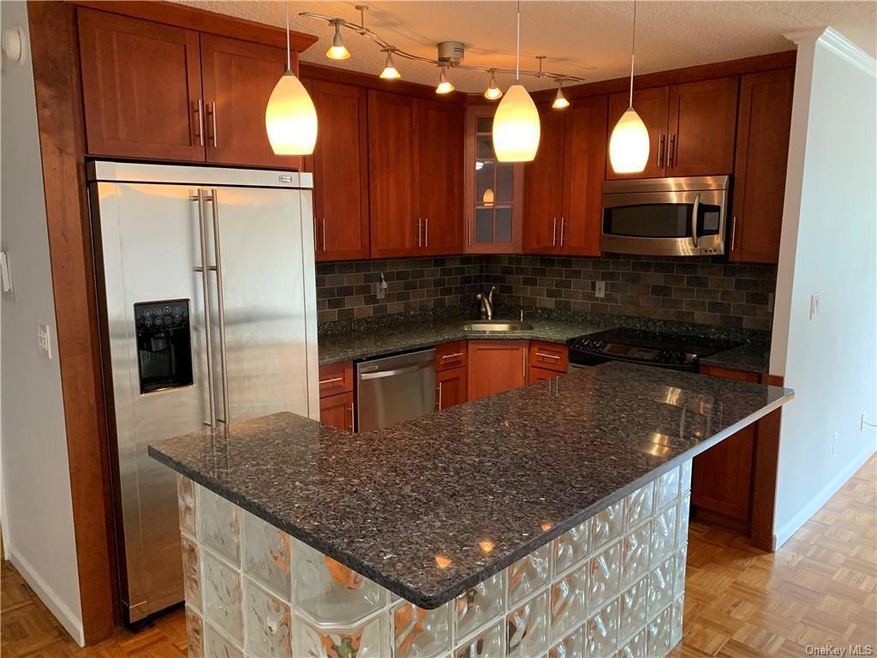
Cozy one-Bedroom plus a Junior 4/office unit on the top floor in Halston House! Large windows with lots of sunlight and beautiful parquet floors throughout. Modern, updated dine-in kitchen with granite counters, stainless appliances and ample cherry cabinetry. Bedroom has walk-in-closet and double closet. Laundry room on each floor and plenty of parking! Lovely resort-like amenities including pool, tennis court, playground and barbeque area. Conveniently located near highways, Metro North, Bee Line bus and shopping. Situated in the historic Rivertowns with abundant trail ways, bike paths and landmarks. Close to shopping, train and all the beautiful Tarrytown has to offer!
Last Agent to Rent the Property
Leggio Realty Group Brokerage Phone: 914-631-2132 License #10311210464 Listed on: 09/13/2024
Last Renter's Agent
Leggio Realty Group Brokerage Phone: 914-631-2132 License #10311210464 Listed on: 09/13/2024
| Date | Buyer | Sale Price | Title Company |
|---|---|---|---|
| Bellber Joseph R | $254,000 | None Available |
| Date | Status | Borrower | Loan Amount |
|---|---|---|---|
| Open | Bellber Joseph R | $200,000 |
| Date | Event | Price | List to Sale | Price per Sq Ft | Prior Sale |
|---|---|---|---|---|---|
| 12/11/2024 12/11/24 | Off Market | $2,250 | -- | -- | |
| 10/07/2024 10/07/24 | Rented | $2,650 | 0.0% | -- | |
| 09/25/2024 09/25/24 | Price Changed | $2,650 | -3.6% | $3 / Sq Ft | |
| 09/13/2024 09/13/24 | For Rent | $2,750 | +7.8% | -- | |
| 09/12/2023 09/12/23 | Rented | $2,550 | -1.9% | -- | |
| 08/11/2023 08/11/23 | Price Changed | $2,600 | -1.9% | $3 / Sq Ft | |
| 07/19/2023 07/19/23 | For Rent | $2,650 | +17.8% | -- | |
| 08/13/2018 08/13/18 | Rented | $2,250 | -2.2% | -- | |
| 07/20/2018 07/20/18 | Under Contract | -- | -- | -- | |
| 07/20/2018 07/20/18 | For Rent | $2,300 | 0.0% | -- | |
| 07/19/2018 07/19/18 | Sold | $285,000 | 0.0% | $313 / Sq Ft | View Prior Sale |
| 05/07/2018 05/07/18 | Pending | -- | -- | -- | |
| 05/07/2018 05/07/18 | For Sale | $285,000 | -- | $313 / Sq Ft |
| Year | Tax Paid | Tax Assessment Tax Assessment Total Assessment is a certain percentage of the fair market value that is determined by local assessors to be the total taxable value of land and additions on the property. | Land | Improvement |
|---|---|---|---|---|
| 2024 | $3,626 | $134,400 | $30,800 | $103,600 |
| 2023 | $3,593 | $122,400 | $30,800 | $91,600 |
| 2022 | $3,866 | $122,400 | $30,800 | $91,600 |
| 2021 | $3,913 | $121,600 | $30,800 | $90,800 |
| 2020 | $3,929 | $119,200 | $9,400 | $109,800 |
| 2019 | $4,871 | $119,200 | $9,400 | $109,800 |
| 2018 | $4,124 | $119,200 | $9,400 | $109,800 |
| 2017 | $2,745 | $125,700 | $9,400 | $116,300 |
| 2016 | $92,578 | $125,700 | $9,400 | $116,300 |
| 2015 | -- | $4,236 | $1,450 | $2,786 |
| 2014 | -- | $4,236 | $1,450 | $2,786 |
| 2013 | -- | $4,236 | $1,450 | $2,786 |
O
Landlord's Agent in 2024
Owen Leggio
Leggio Realty Group
16 in this area
21 Total Sales
C
Seller's Agent in 2018
Cheryl Rego
Houlihan Lawrence Inc.
H
Seller's Agent in 2018
Hannah Sackelman
Houlihan Lawrence Inc.
(914) 582-9737
3 in this area
13 Total Sales
I
Seller Co-Listing Agent in 2018
Iris Greenberg
Houlihan Lawrence Inc.
(914) 806-6721
3 Total Sales
G
Buyer's Agent in 2018
George Muniz
Keller Williams NY Realty
(914) 299-1029
67 Total Sales
Source: OneKey® MLS
MLS Number: KEY6327326
APN: 2689-007-171-00050-000-0002-0-6D14
Disclaimer: Certain information contained herein is derived from information provided by parties other than Homes.com. All information provided is deemed reliable, but is not guaranteed to be accurate and should be independently verified.
![]() The data relating to real estate for sale or lease on this web site comes in part from OneKey® MLS. Real estate listings held by brokerage firms other than Ten-X are marked with the OneKey® MLS logo or an abbreviated logo and detailed information about them includes the name of the listing broker.
The data relating to real estate for sale or lease on this web site comes in part from OneKey® MLS. Real estate listings held by brokerage firms other than Ten-X are marked with the OneKey® MLS logo or an abbreviated logo and detailed information about them includes the name of the listing broker.
IDX information is provided exclusively for personal, non-commercial use, and may not be used for any purpose other than to identify prospective properties consumers may be interested in purchasing.
Information is deemed reliable but not guaranteed.
Copyright 2025 OneKey® MLS. All rights reserved.
