C
Seller's Agent in 2015
Carolyn Goeldner
Vanguard Properties
(415) 655-5600
18 Total Sales

Estimated Value: $1,610,000 - $2,789,000
Property Id: 1427595
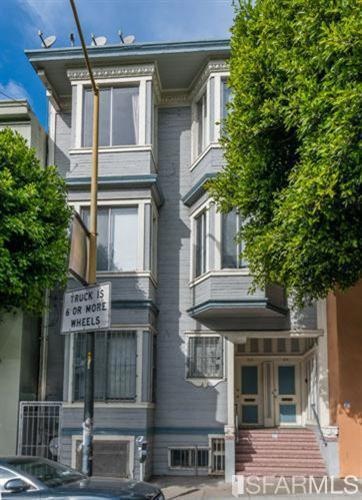
Welcome to Your New Home at 416 Bryant Street in San Francisco! Are you seeking a blend of comfort and modernity in the heart of the South of Market in the city? Look no further! This 1-bedroom, with 2 shared bathrooms, is now available for just $1750/monthly -with one year lease agreement- plus utilities and last month's rent. Tucked away in a secure building equipped with security cameras for your peace of mind, this residence offers the utmost convenience and tranquility. Experience the joys of urban living with contemporary amenities and a coveted location near the ballpark, financial district, Caltrain station, Safeway, as well as a plethora of cafes and restaurants. With parks within reach and seamless access to downtown San Francisco, you'll find endless opportunities to explore and enjoy all that the city has to offer. Schedule a viewing today and embark on a journey of urban living at its finest.
Last Agent to Sell the Property
Vanguard Properties License #DRE #00907558 Listed on: 02/06/2015

Last Buyer's Agent
Komendi Kosasih
Ground Matrix License #01376575
| Date | Buyer | Sale Price | Title Company |
|---|---|---|---|
| Private Assets Holder Llc | $1,700,000 | Old Republic Title | |
| Southwest Invs Funds Llc | $1,480,000 | Old Republic Title | |
| 15Th St Sf Holdings Llc | $1,038,000 | None Listed On Document | |
| 412 Bryant St Llc | $3,480,000 | Old Republic Title Co | |
| Bryant Hub Llc | $895,000 | Accommodation | |
| Kosasih Komendi | -- | First American Title Company | |
| Bryant Hub Llc | $2,050,000 | First American Title Co | |
| Haskins Sam | -- | None Available | |
| Haskins Sam | -- | Fidelity National Title Co | |
| Haskins Sam | -- | -- | |
| Haskins Sam | $415,000 | Old Republic Title Company |
| Date | Status | Borrower | Loan Amount |
|---|---|---|---|
| Closed | Private Assets Holder Llc | $850,000 | |
| Previous Owner | 412 Bryant St Llc | $2,665,000 | |
| Previous Owner | Bryant Hub Llc | $1,400,000 | |
| Previous Owner | Haskins Sam | $480,000 | |
| Previous Owner | Haskins Sam | $290,500 |
| Date | Event | Price | List to Sale | Price per Sq Ft |
|---|---|---|---|---|
| 01/27/2026 01/27/26 | Off Market | $1,750 | -- | -- |
| 12/07/2025 12/07/25 | For Rent | $1,750 | 0.0% | -- |
| 05/13/2015 05/13/15 | Sold | $2,050,000 | 0.0% | $456 / Sq Ft |
| 04/23/2015 04/23/15 | Pending | -- | -- | -- |
| 02/06/2015 02/06/15 | For Sale | $2,050,000 | -- | $456 / Sq Ft |
| Year | Tax Paid | Tax Assessment Tax Assessment Total Assessment is a certain percentage of the fair market value that is determined by local assessors to be the total taxable value of land and additions on the property. | Land | Improvement |
|---|---|---|---|---|
| 2025 | $21,239 | $1,734,000 | $1,127,100 | $606,900 |
| 2024 | $21,239 | $1,700,000 | $1,105,000 | $595,000 |
| 2023 | $46,375 | $3,839,140 | $2,283,532 | $1,555,608 |
| 2022 | $45,483 | $3,763,863 | $2,238,757 | $1,525,106 |
| 2021 | $44,718 | $3,692,063 | $2,194,860 | $1,497,203 |
| 2020 | $45,030 | $3,654,228 | $2,172,355 | $1,481,873 |
| 2019 | $43,494 | $3,582,617 | $2,129,760 | $1,452,857 |
| 2018 | $26,384 | $2,167,339 | $1,515,739 | $651,600 |
| 2017 | $25,781 | $2,124,883 | $1,486,019 | $638,864 |
| 2016 | $25,382 | $2,083,260 | $1,456,882 | $626,378 |
| 2015 | $7,607 | $575,626 | $138,219 | $437,407 |
| 2014 | $7,417 | $564,390 | $135,512 | $428,878 |
C
Seller's Agent in 2015
Carolyn Goeldner
Vanguard Properties
(415) 655-5600
18 Total Sales
K
Buyer's Agent in 2015
Komendi Kosasih
Ground Matrix
Source: San Francisco Association of REALTORS®
MLS Number: 429454
APN: 3763-008
Disclaimer: Certain information contained herein is derived from information provided by parties other than Homes.com. All information provided is deemed reliable, but is not guaranteed to be accurate and should be independently verified.
![]() IDX information is provided exclusively for personal, non-commercial use, and may not be used for any purpose other than to identify prospective properties consumers may be interested in purchasing.
IDX information is provided exclusively for personal, non-commercial use, and may not be used for any purpose other than to identify prospective properties consumers may be interested in purchasing.
Information is deemed reliable but not guaranteed.
Ask me questions while you tour the home.