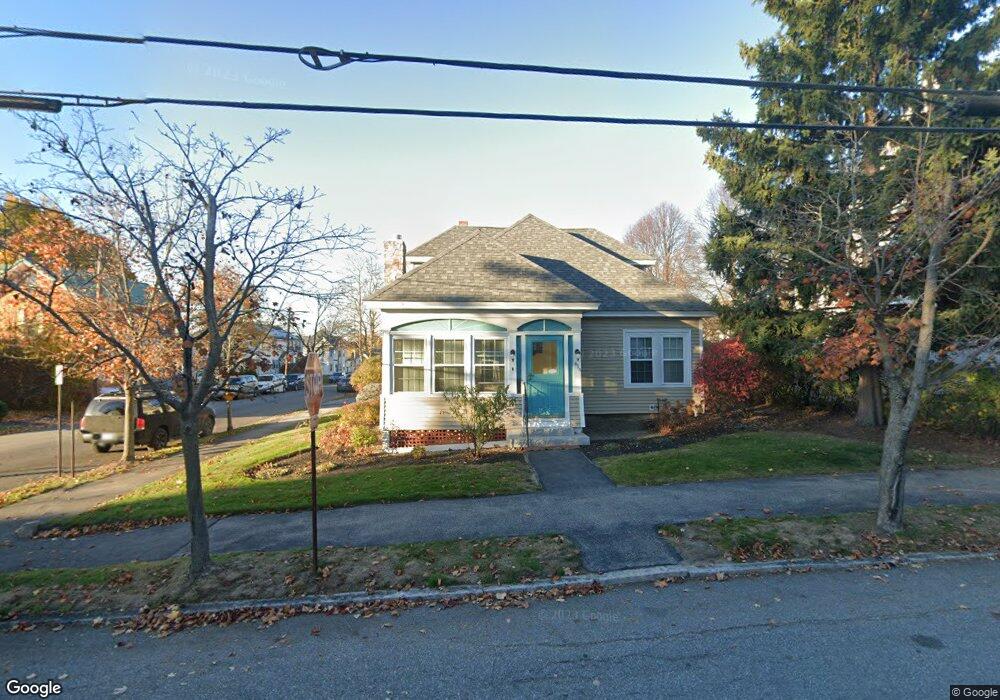
414 E High St Manchester, NH 03104
Hanover Hill NeighborhoodEstimated Value: $486,264 - $601,000
4
Beds
2
Baths
2,174
Sq Ft
$252/Sq Ft
Est. Value
About This Home
This home is located at 414 E High St, Manchester, NH 03104 and is currently estimated at $546,816, approximately $251 per square foot. 414 E High St is a home located in Hillsborough County with nearby schools including McDonough Elementary School, Hillside Middle School, and Manchester Central High School.
Ownership History
Date
Name
Owned For
Owner Type
Purchase Details
Closed on
Jul 29, 2004
Sold by
Loukedes Stephen P and Loukedes Irene
Bought by
Paprocki Adam
Current Estimated Value
Home Financials for this Owner
Home Financials are based on the most recent Mortgage that was taken out on this home.
Original Mortgage
$233,600
Interest Rate
6.33%
Mortgage Type
Purchase Money Mortgage
Create a Home Valuation Report for This Property
The Home Valuation Report is an in-depth analysis detailing your home's value as well as a comparison with similar homes in the area
Home Values in the Area
Average Home Value in this Area
Purchase History
| Date | Buyer | Sale Price | Title Company |
|---|---|---|---|
| Paprocki Adam | $292,000 | -- |
Source: Public Records
Mortgage History
| Date | Status | Borrower | Loan Amount |
|---|---|---|---|
| Open | Paprocki Adam | $235,000 | |
| Closed | Paprocki Adam | $240,000 | |
| Closed | Paprocki Adam | $233,600 |
Source: Public Records
Tax History Compared to Growth
Tax History
| Year | Tax Paid | Tax Assessment Tax Assessment Total Assessment is a certain percentage of the fair market value that is determined by local assessors to be the total taxable value of land and additions on the property. | Land | Improvement |
|---|---|---|---|---|
| 2024 | $6,548 | $334,400 | $87,900 | $246,500 |
| 2023 | $6,307 | $334,400 | $87,900 | $246,500 |
| 2022 | $6,099 | $334,400 | $87,900 | $246,500 |
| 2021 | $5,912 | $334,400 | $87,900 | $246,500 |
| 2020 | $5,478 | $205,200 | $63,800 | $141,400 |
| 2019 | $5,272 | $205,200 | $63,800 | $141,400 |
| 2018 | $4,859 | $205,200 | $63,800 | $141,400 |
| 2017 | $3,946 | $205,200 | $63,800 | $141,400 |
| 2016 | $4,748 | $205,200 | $63,800 | $141,400 |
| 2015 | $4,484 | $191,300 | $63,800 | $127,500 |
| 2014 | $4,496 | $191,300 | $63,800 | $127,500 |
| 2013 | $4,337 | $191,300 | $63,800 | $127,500 |
Source: Public Records
Map
Nearby Homes
- 649 Belmont St Unit 1
- 649 Belmont St
- 649 Belmont St Unit 2
- 649 Belmont St
- 420 E High St
- 418 E High St
- 648 Belmont St
- 406 E High St
- 653 Belmont St
- 387 E High St
- 635 Belmont St
- 401 Bridge St
- 401 Bridge St Unit 2
- 658 Belmont St
- 634 Belmont St
- 426 E High St
- 421 E High St
- 430 E High St
- 398 E High St
- 632 Belmont St