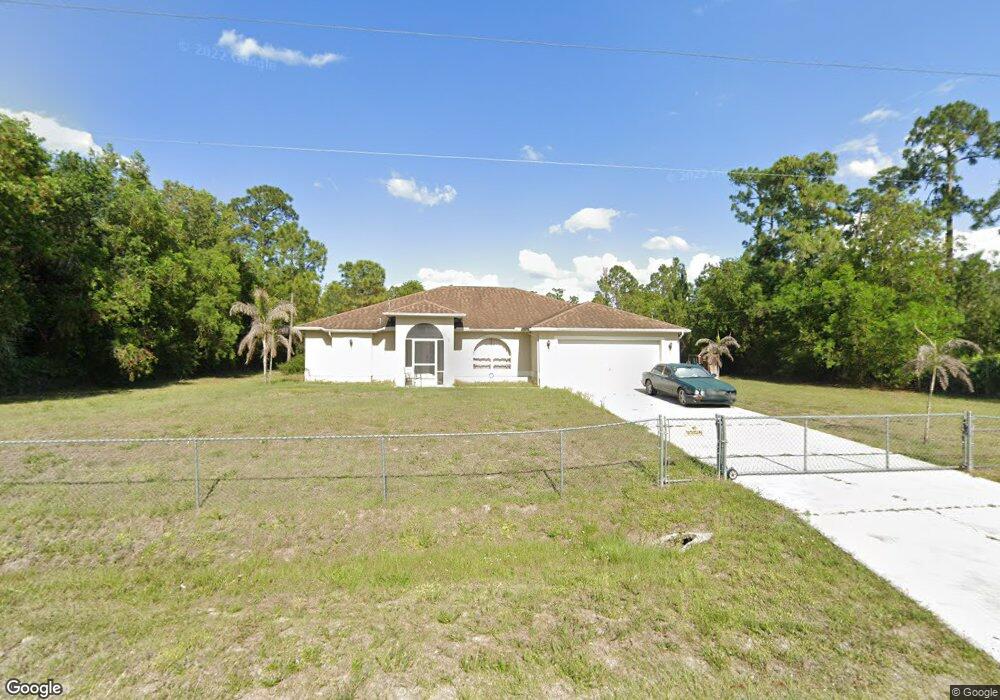
414 Grant Ave Unit 3 Lehigh Acres, FL 33972
Joel NeighborhoodEstimated Value: $254,000 - $381,000
3
Beds
3
Baths
2,023
Sq Ft
$163/Sq Ft
Est. Value
About This Home
This home is located at 414 Grant Ave Unit 3, Lehigh Acres, FL 33972 and is currently estimated at $329,823, approximately $163 per square foot. 414 Grant Ave Unit 3 is a home located in Lee County with nearby schools including Lehigh Elementary School, The Alva School, and Gateway Elementary School.
Ownership History
Date
Name
Owned For
Owner Type
Purchase Details
Closed on
Sep 16, 2011
Sold by
Jj Asset Management Corporation
Bought by
Reilly Erin
Current Estimated Value
Purchase Details
Closed on
Aug 10, 2011
Sold by
Kantenwein Joachim
Bought by
Jj Asset Management
Purchase Details
Closed on
Jul 8, 2011
Sold by
Delfin Ricardo
Bought by
Kantenwein Joachim B
Purchase Details
Closed on
Oct 18, 2010
Sold by
Delfin Ricardo and Pena Ricardo
Bought by
Delfin Ricardo
Purchase Details
Closed on
Feb 18, 2008
Sold by
Delfin Jose G
Bought by
Delfin Jose G and Delfin Ricardo
Purchase Details
Closed on
May 17, 2004
Sold by
Delfin Ricardo Pena
Bought by
Delfin Jose Genaro
Home Financials for this Owner
Home Financials are based on the most recent Mortgage that was taken out on this home.
Original Mortgage
$147,850
Interest Rate
5.88%
Mortgage Type
New Conventional
Purchase Details
Closed on
Dec 5, 2003
Sold by
Delfin Ricardo Pena
Bought by
Delfin Jose Genaro
Create a Home Valuation Report for This Property
The Home Valuation Report is an in-depth analysis detailing your home's value as well as a comparison with similar homes in the area
Home Values in the Area
Average Home Value in this Area
Purchase History
| Date | Buyer | Sale Price | Title Company |
|---|---|---|---|
| Reilly Erin | $75,000 | Attorney | |
| Jj Asset Management | $54,000 | None Available | |
| Kantenwein Joachim B | $54,000 | Sky Title Services Inc | |
| Delfin Ricardo | -- | None Available | |
| Delfin Jose G | -- | Florida Title Solutions Llc | |
| Delfin Jose Genaro | -- | Title Offices Llc | |
| Delfin Jose Genaro | -- | -- |
Source: Public Records
Mortgage History
| Date | Status | Borrower | Loan Amount |
|---|---|---|---|
| Previous Owner | Delfin Jose Genaro | $147,850 |
Source: Public Records
Tax History Compared to Growth
Tax History
| Year | Tax Paid | Tax Assessment Tax Assessment Total Assessment is a certain percentage of the fair market value that is determined by local assessors to be the total taxable value of land and additions on the property. | Land | Improvement |
|---|---|---|---|---|
| 2025 | $3,770 | $246,989 | -- | -- |
| 2024 | $3,740 | $224,535 | -- | -- |
| 2023 | $3,740 | $204,123 | $0 | $0 |
| 2022 | $3,466 | $185,566 | $0 | $0 |
| 2021 | $2,917 | $191,259 | $18,921 | $172,338 |
| 2020 | $2,796 | $179,264 | $7,650 | $171,614 |
| 2019 | $2,681 | $171,196 | $6,120 | $165,076 |
| 2018 | $2,511 | $155,852 | $5,738 | $150,114 |
| 2017 | $2,424 | $151,827 | $5,610 | $146,217 |
| 2016 | $2,202 | $129,006 | $12,556 | $116,450 |
| 2015 | $1,993 | $109,399 | $9,907 | $99,492 |
| 2014 | $1,824 | $97,301 | $9,110 | $88,191 |
| 2013 | -- | $82,805 | $8,847 | $73,958 |
Source: Public Records
Map
Nearby Homes
- 418 Grant Ave
- 420 Grant Ave
- 418 Wellington Ave
- 420 Truman Ave
- 3407 E 5th St
- 413 Truman Ave
- 323 Grant Ave
- 509 Johns Ave
- 509 Truman Ave
- 318 Grant Ave
- 326 Johns Ave
- 505 Leroy Ave
- 316 Grant Ave
- 319 Johns Ave
- 502 Leroy Ave
- 409 Columbus Ave
- 104 Columbus Ave
- 102 Columbus Ave
- 410 Hamilton Ave Unit 13
- 408 Hamilton Ave
- 412 Grant Ave
- 415 Wellington Ave Unit 3
- 417 Wellington Ave Unit 3
- 410 Grant Ave
- 415 Grant Ave Unit 31
- 411 Wellington Ave
- 408 Grant Ave
- 421 Wellington Ave
- 3400 5th St W
- 409 Wellington Ave
- 409 Grant Ave
- 3306 E 5th St
- 414 Wellington Ave Unit 1
- 414 Truman Ave
- 412 Truman Ave
- 407 Wellington Ave
- 418 Truman Ave
- 407 Grant Ave
- 410 Truman Ave
- 3401 E 5th St