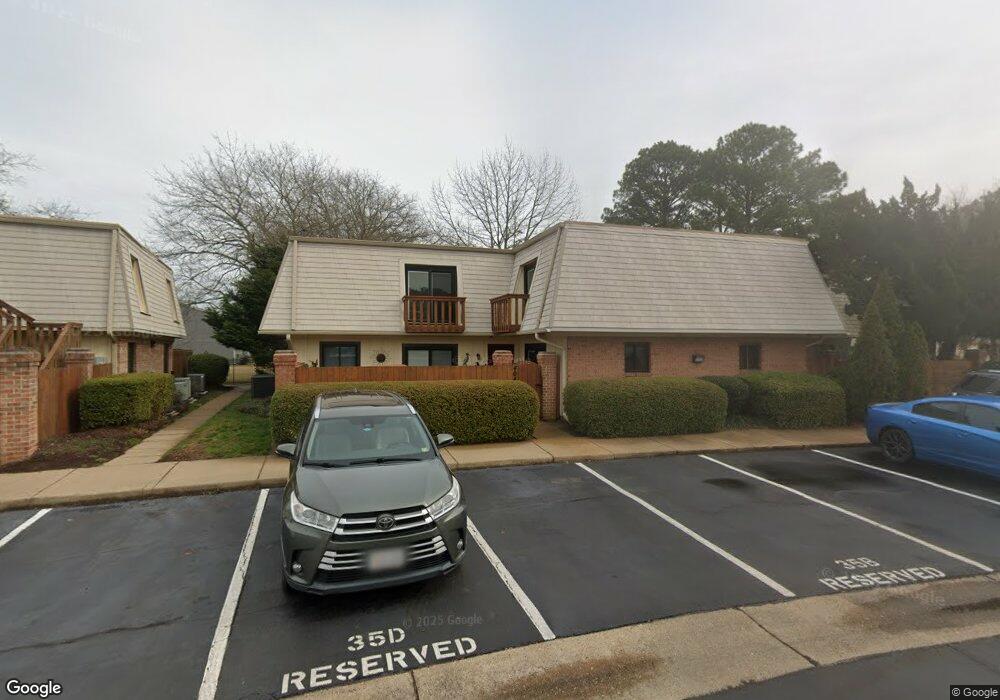
414 Marsh Duck Way Virginia Beach, VA 23451
Shadowlawn NeighborhoodEstimated Value: $275,000 - $297,000
2
Beds
2
Baths
948
Sq Ft
$300/Sq Ft
Est. Value
About This Home
This home is located at 414 Marsh Duck Way, Virginia Beach, VA 23451 and is currently estimated at $284,002, approximately $299 per square foot. 414 Marsh Duck Way is a home located in Virginia Beach City with nearby schools including W.T. Cooke Elementary School, Virginia Beach Middle School, and First Colonial High School.
Ownership History
Date
Name
Owned For
Owner Type
Purchase Details
Closed on
Jan 26, 2024
Sold by
Dupre-Rios Christopher
Bought by
Chapel Group Llc
Current Estimated Value
Purchase Details
Closed on
Aug 12, 2020
Sold by
Patiniotis George
Bought by
Dupre Rios Christopher
Home Financials for this Owner
Home Financials are based on the most recent Mortgage that was taken out on this home.
Original Mortgage
$140,625
Interest Rate
3%
Mortgage Type
New Conventional
Purchase Details
Closed on
Jul 22, 2002
Sold by
Caldwell Robin
Bought by
Duncan C C Matthew
Home Financials for this Owner
Home Financials are based on the most recent Mortgage that was taken out on this home.
Original Mortgage
$64,500
Interest Rate
6.58%
Purchase Details
Closed on
Mar 23, 1999
Sold by
Darby Dan L
Bought by
Fleming Robin L
Home Financials for this Owner
Home Financials are based on the most recent Mortgage that was taken out on this home.
Original Mortgage
$56,250
Interest Rate
6.78%
Create a Home Valuation Report for This Property
The Home Valuation Report is an in-depth analysis detailing your home's value as well as a comparison with similar homes in the area
Home Values in the Area
Average Home Value in this Area
Purchase History
| Date | Buyer | Sale Price | Title Company |
|---|---|---|---|
| Chapel Group Llc | -- | None Listed On Document | |
| Dupre Rios Christopher | $187,500 | Fidelity National Ttl Ins Co | |
| Duncan C C Matthew | $66,500 | -- | |
| Fleming Robin L | $58,000 | -- |
Source: Public Records
Mortgage History
| Date | Status | Borrower | Loan Amount |
|---|---|---|---|
| Previous Owner | Dupre Rios Christopher | $140,625 | |
| Previous Owner | Duncan C C Matthew | $64,500 | |
| Previous Owner | Fleming Robin L | $56,250 |
Source: Public Records
Tax History Compared to Growth
Tax History
| Year | Tax Paid | Tax Assessment Tax Assessment Total Assessment is a certain percentage of the fair market value that is determined by local assessors to be the total taxable value of land and additions on the property. | Land | Improvement |
|---|---|---|---|---|
| 2025 | $2,332 | $265,900 | $95,000 | $170,900 |
| 2024 | $2,332 | $240,400 | $95,000 | $145,400 |
| 2023 | $2,219 | $224,100 | $89,000 | $135,100 |
| 2022 | $2,000 | $202,000 | $75,000 | $127,000 |
| 2021 | $1,800 | $181,800 | $75,000 | $106,800 |
| 2020 | $1,682 | $165,300 | $75,000 | $90,300 |
| 2019 | $1,637 | $147,800 | $67,000 | $80,800 |
| 2018 | $1,482 | $147,800 | $67,000 | $80,800 |
| 2017 | $1,492 | $148,800 | $68,000 | $80,800 |
| 2016 | $1,474 | $148,900 | $69,600 | $79,300 |
| 2015 | $1,405 | $141,900 | $69,600 | $72,300 |
| 2014 | $1,397 | $144,200 | $74,600 | $69,600 |
Source: Public Records
Map
Nearby Homes
- 926 13th St
- 1132 Ocean Pebbles Way
- 1307 Parks Ave
- 729 Virginia Ave Unit X4660
- 731 Carolina Ave
- 726 Carolina Ave
- 1207 Cypress Ave
- 1509 Parks Ave
- 625 13th St
- 722 16th St Unit B
- 1093 Kenya Ln
- 1512 Colonnade Dr
- 1304 Mediterranean Ave
- 538 13th St
- 518 Norfolk Ave Unit B
- 636 Foster Ln
- 624 Foster Ln
- 1623 Colonnade Crescent Unit X9615
- 616 Foster Ln
- 504 Norfolk Ave
- 412 Marsh Duck Way
- 410 Marsh Duck Way
- 410 Marsh Duck Way Unit 36A2
- 422 Marsh Duck Way
- 404 Marsh Duck Way
- 418 Marsh Duck Way
- 406 Marsh Duck Way
- 420 Marsh Duck Way
- 420 Marsh Duck Way Unit 36D1
- 416 Marsh Duck Way
- 432 Marsh Duck Way
- 400 Marsh Duck Way
- 436 Marsh Duck Way
- 440 Marsh Duck Way
- 402 Marsh Duck Way
- 1180 Indian Rd
- 1176 Indian Rd
- 430 Marsh Duck Way
- 446 Marsh Duck Way
- 1178 Indian Rd