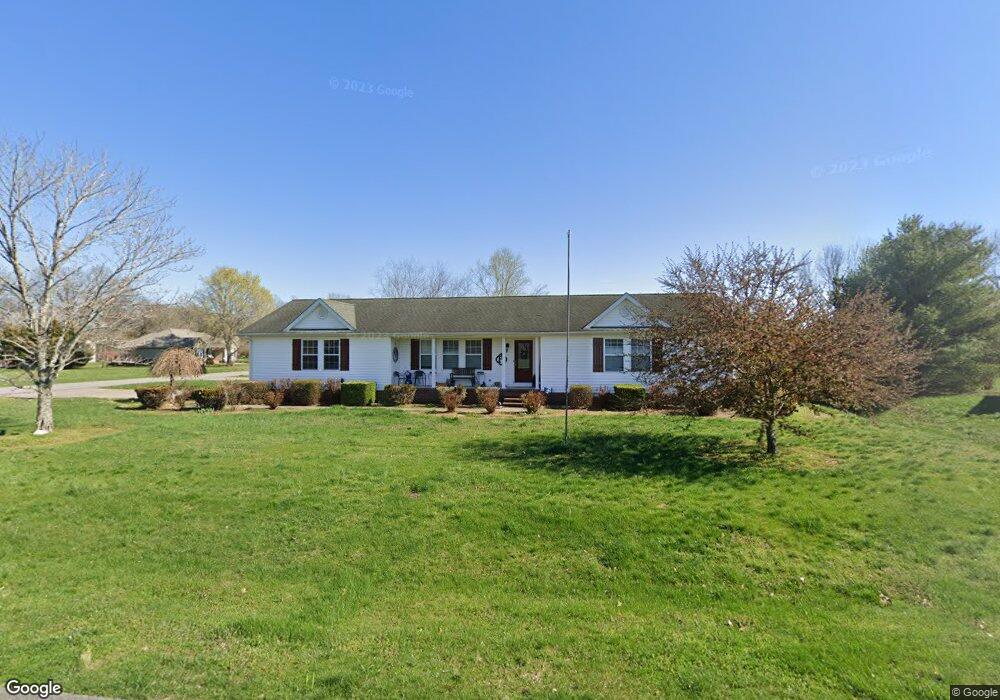
414 Meadowlark Dr Shelbyville, TN 37160
Estimated Value: $328,447 - $488,000
--
Bed
2
Baths
2,229
Sq Ft
$188/Sq Ft
Est. Value
About This Home
This home is located at 414 Meadowlark Dr, Shelbyville, TN 37160 and is currently estimated at $419,612, approximately $188 per square foot. 414 Meadowlark Dr is a home located in Bedford County with nearby schools including Liberty Elementary School, Christian Chapel Academy, and Victory Baptist Academy.
Ownership History
Date
Name
Owned For
Owner Type
Purchase Details
Closed on
Mar 26, 2003
Sold by
Okeefe Dorothy
Bought by
Holtz Robert and Holtz Dawn
Current Estimated Value
Home Financials for this Owner
Home Financials are based on the most recent Mortgage that was taken out on this home.
Original Mortgage
$35,000
Outstanding Balance
$14,981
Interest Rate
5.82%
Estimated Equity
$404,631
Purchase Details
Closed on
Jun 24, 1996
Sold by
Harris James and Harris Melanie
Bought by
Okeefe Dorothy A
Purchase Details
Closed on
Jun 5, 1995
Sold by
Palmer Annette S
Bought by
Harris James and Harris Melanie
Purchase Details
Closed on
Sep 15, 1994
Bought by
Spain Tommy Denita
Purchase Details
Closed on
Jan 13, 1992
Bought by
Palmer Annette S
Purchase Details
Closed on
Jan 3, 1984
Bought by
Palmer Jack M and Palmer Annette E
Create a Home Valuation Report for This Property
The Home Valuation Report is an in-depth analysis detailing your home's value as well as a comparison with similar homes in the area
Home Values in the Area
Average Home Value in this Area
Purchase History
| Date | Buyer | Sale Price | Title Company |
|---|---|---|---|
| Holtz Robert | $113,000 | -- | |
| Okeefe Dorothy A | $91,500 | -- | |
| Harris James | $88,800 | -- | |
| Spain Tommy Denita | $9,500 | -- | |
| Palmer Annette S | -- | -- | |
| Palmer Jack M | -- | -- |
Source: Public Records
Mortgage History
| Date | Status | Borrower | Loan Amount |
|---|---|---|---|
| Open | Palmer Jack M | $35,000 |
Source: Public Records
Tax History Compared to Growth
Tax History
| Year | Tax Paid | Tax Assessment Tax Assessment Total Assessment is a certain percentage of the fair market value that is determined by local assessors to be the total taxable value of land and additions on the property. | Land | Improvement |
|---|---|---|---|---|
| 2025 | $1,543 | $66,350 | $0 | $0 |
| 2024 | $1,543 | $66,350 | $8,850 | $57,500 |
| 2023 | $1,543 | $66,350 | $8,850 | $57,500 |
| 2022 | $1,543 | $66,350 | $8,850 | $57,500 |
| 2021 | $1,304 | $66,350 | $8,850 | $57,500 |
| 2020 | $1,094 | $66,350 | $8,850 | $57,500 |
| 2019 | $1,094 | $41,125 | $5,150 | $35,975 |
| 2018 | $1,053 | $41,125 | $5,150 | $35,975 |
| 2017 | $1,053 | $41,125 | $5,150 | $35,975 |
| 2016 | $1,036 | $41,125 | $5,150 | $35,975 |
| 2015 | $1,036 | $41,125 | $5,150 | $35,975 |
| 2014 | $880 | $38,765 | $0 | $0 |
Source: Public Records
Map
Nearby Homes
- 1519 Highway 130 E
- 0 Highway 130 E
- 1413 Highway 130 E
- 201 Sulphur Springs Rd
- 1024 Tennessee 64
- 1725 Wartrace Pike
- 128 Riverlake Rd
- 0 Himesville Rd
- 215 Coney Island Rd
- 339 Riverbend Country Club Rd
- 102 Germantown Rd
- 211 S Fairoak St
- 1404 Cypress St
- 107 Rockwood Dr
- 204 S Hillcrest Dr
- 314 Maplewood Dr
- 222 Carter St
- 112 Elizabeth St
- 231 Riverbend Country Club Rd
- 148 Maupin Cir
- 412 Meadowlark Dr
- 508 Meadowlark Dr
- 505 Meadowlark Dr
- 413 Meadowlark Dr
- 507 Meadowlark Dr
- 410 Meadowlark Dr
- 106 Oriole Cir
- 501 Meadowlark Dr
- 509 Meadowlark Dr
- 510 Meadowlark Dr
- 108 Oriole Cir
- 411 Meadowlark Dr
- 408 Meadowlark Dr
- 511 Meadowlark Dr
- 409 Meadowlark Dr
- 107 Oriole Cir
- 512 Meadowlark Dr
- 102 Oriole Cir
- 406 Meadowlark Dr
- 513 Meadowlark Dr