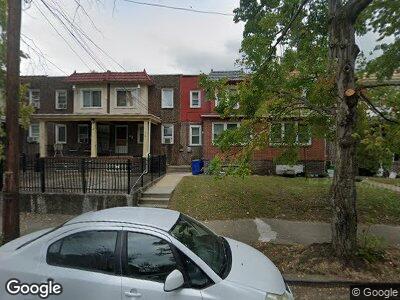
414 N 40th St Pennsauken, NJ 08110
Rosedale NeighborhoodEstimated Value: $150,000 - $269,000
--
Bed
--
Bath
1,168
Sq Ft
$172/Sq Ft
Est. Value
About This Home
This home is located at 414 N 40th St, Pennsauken, NJ 08110 and is currently estimated at $200,613, approximately $171 per square foot. 414 N 40th St is a home located in Camden County with nearby schools including Davis Elementary School, Eastside High School, and St. Cecilia School.
Ownership History
Date
Name
Owned For
Owner Type
Purchase Details
Closed on
Jun 24, 2021
Sold by
U S Bank National Association
Bought by
Rosado Rafael Bolivar
Current Estimated Value
Purchase Details
Closed on
Oct 31, 2019
Sold by
Delgado Raymond
Bought by
U S Bank National Association
Purchase Details
Closed on
Aug 28, 2000
Sold by
Tobolsky Nelson
Bought by
Delgado Raymond and Delgado Elysabett
Home Financials for this Owner
Home Financials are based on the most recent Mortgage that was taken out on this home.
Original Mortgage
$48,926
Interest Rate
7.94%
Mortgage Type
FHA
Create a Home Valuation Report for This Property
The Home Valuation Report is an in-depth analysis detailing your home's value as well as a comparison with similar homes in the area
Home Values in the Area
Average Home Value in this Area
Purchase History
| Date | Buyer | Sale Price | Title Company |
|---|---|---|---|
| Rosado Rafael Bolivar | $71,040 | None Available | |
| U S Bank National Association | -- | None Available | |
| Delgado Raymond | $48,500 | -- |
Source: Public Records
Mortgage History
| Date | Status | Borrower | Loan Amount |
|---|---|---|---|
| Previous Owner | Delgado Raymond | $48,926 |
Source: Public Records
Tax History Compared to Growth
Tax History
| Year | Tax Paid | Tax Assessment Tax Assessment Total Assessment is a certain percentage of the fair market value that is determined by local assessors to be the total taxable value of land and additions on the property. | Land | Improvement |
|---|---|---|---|---|
| 2024 | $2,031 | $59,300 | $19,600 | $39,700 |
| 2023 | $2,031 | $59,300 | $19,600 | $39,700 |
| 2022 | $1,993 | $59,300 | $19,600 | $39,700 |
| 2021 | $1,986 | $59,300 | $19,600 | $39,700 |
| 2020 | $1,886 | $59,300 | $19,600 | $39,700 |
| 2019 | $1,806 | $59,300 | $19,600 | $39,700 |
| 2018 | $1,796 | $59,300 | $19,600 | $39,700 |
| 2017 | $1,752 | $59,300 | $19,600 | $39,700 |
| 2016 | $1,697 | $59,300 | $19,600 | $39,700 |
| 2015 | $1,633 | $59,300 | $19,600 | $39,700 |
| 2014 | $1,594 | $59,300 | $19,600 | $39,700 |
Source: Public Records
Map
Nearby Homes