Estimated Value: $228,000 - $320,746
5
Beds
4
Baths
3,286
Sq Ft
$80/Sq Ft
Est. Value
About This Home
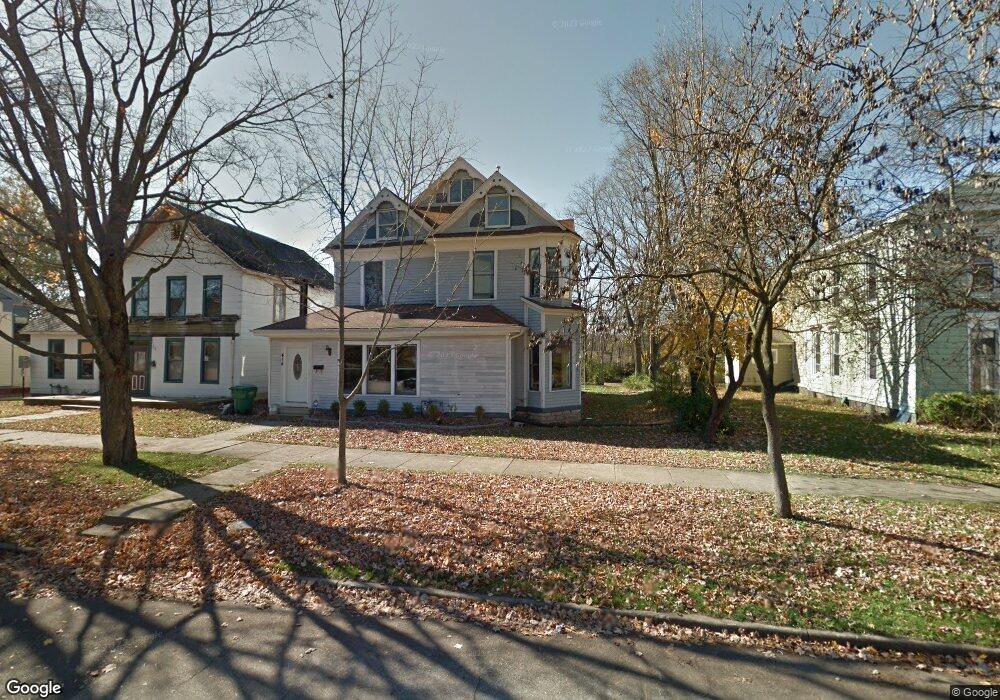
This home is located at 414 N 4th St, Niles, MI 49120 and is currently estimated at $264,437, approximately $80 per square foot. 414 N 4th St is a home located in Berrien County with nearby schools including Ballard Elementary School, Oak Manor Sixth Grade Center, and Ring Lardner Middle School.
Ownership History
Date
Name
Owned For
Owner Type
Purchase Details
Closed on
Jun 13, 2023
Sold by
Dad Company
Bought by
Berrien County Treasurer
Current Estimated Value
Purchase Details
Closed on
Sep 2, 2011
Sold by
Fannie Mae
Bought by
Dad Company
Purchase Details
Closed on
Apr 29, 2010
Sold by
Flood James
Bought by
Federal National Mortgage Association
Purchase Details
Closed on
Aug 30, 2007
Sold by
Summerfield David S and Summerfield Julia C
Bought by
Flood James
Home Financials for this Owner
Home Financials are based on the most recent Mortgage that was taken out on this home.
Original Mortgage
$108,000
Interest Rate
6.72%
Mortgage Type
New Conventional
Purchase Details
Closed on
Feb 12, 1985
Purchase Details
Closed on
Nov 12, 1982
Purchase Details
Closed on
Apr 8, 1982
Create a Home Valuation Report for This Property
The Home Valuation Report is an in-depth analysis detailing your home's value as well as a comparison with similar homes in the area
Home Values in the Area
Average Home Value in this Area
Purchase History
| Date | Buyer | Sale Price | Title Company |
|---|---|---|---|
| Berrien County Treasurer | -- | -- | |
| Dad Company | $16,500 | Etitle Agency Inc | |
| Federal National Mortgage Association | $112,518 | None Available | |
| Flood James | $120,000 | Federal Title Agency | |
| -- | $21,500 | -- | |
| -- | $17,500 | -- | |
| -- | $16,500 | -- |
Source: Public Records
Mortgage History
| Date | Status | Borrower | Loan Amount |
|---|---|---|---|
| Previous Owner | Flood James | $108,000 |
Source: Public Records
Tax History
| Year | Tax Paid | Tax Assessment Tax Assessment Total Assessment is a certain percentage of the fair market value that is determined by local assessors to be the total taxable value of land and additions on the property. | Land | Improvement |
|---|---|---|---|---|
| 2025 | $3,255 | $123,500 | $0 | $0 |
| 2024 | $1,738 | $101,500 | $0 | $0 |
| 2023 | $1,666 | $83,300 | $0 | $0 |
| 2022 | $1,626 | $57,300 | $0 | $0 |
| 2021 | $2,869 | $54,200 | $2,400 | $51,800 |
| 2020 | $1,916 | $51,900 | $0 | $0 |
| 2019 | $1,892 | $28,700 | $2,200 | $26,500 |
| 2018 | $517 | $28,700 | $0 | $0 |
| 2017 | $511 | $34,500 | $0 | $0 |
| 2016 | $503 | $31,100 | $0 | $0 |
| 2015 | $501 | $29,200 | $0 | $0 |
| 2014 | $256 | $27,000 | $0 | $0 |
Source: Public Records
Map
Nearby Homes
Your Personal Tour Guide
Ask me questions while you tour the home.