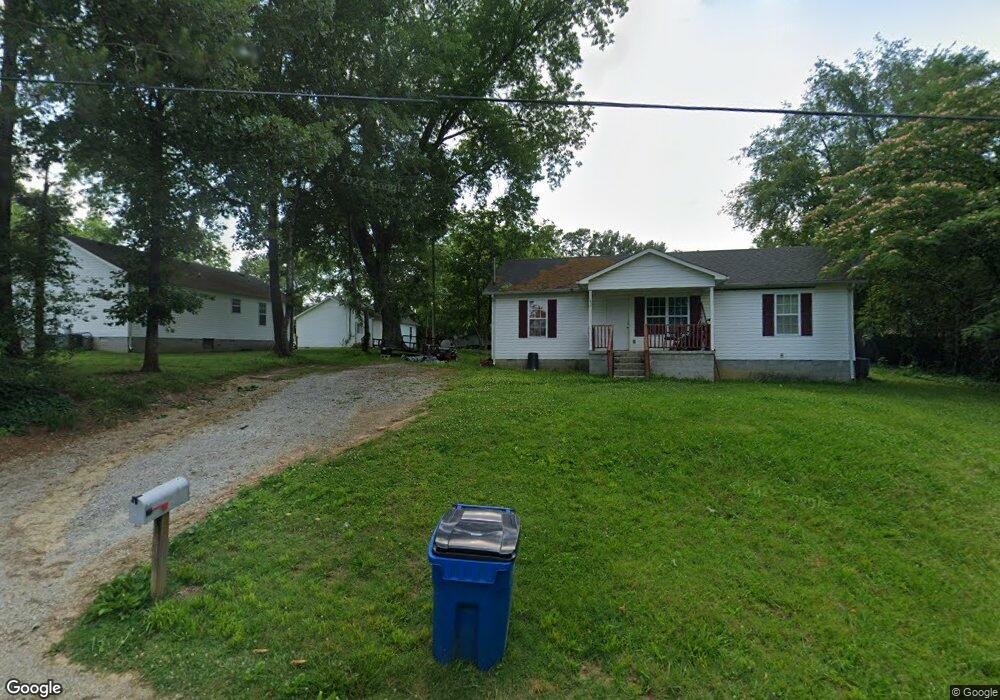
414 Oak St Manchester, TN 37355
Estimated Value: $194,000 - $533,713
--
Bed
2
Baths
2,064
Sq Ft
$211/Sq Ft
Est. Value
About This Home
This home is located at 414 Oak St, Manchester, TN 37355 and is currently estimated at $435,678, approximately $211 per square foot. 414 Oak St is a home located in Coffee County with nearby schools including Westwood Middle School and Temple Baptist Christian School.
Ownership History
Date
Name
Owned For
Owner Type
Purchase Details
Closed on
Jan 31, 2025
Sold by
Buffalo Valley Inc
Bought by
Kirby Kenneth and Barrera Pedro Martinez
Current Estimated Value
Purchase Details
Closed on
Dec 31, 2003
Sold by
Miller Johnny Neal
Bought by
Buffalo Valley Inc
Purchase Details
Closed on
Jun 14, 1999
Sold by
Pack Bill
Bought by
Miller Johnny N and Miller Carolyn
Purchase Details
Closed on
Jun 4, 1999
Create a Home Valuation Report for This Property
The Home Valuation Report is an in-depth analysis detailing your home's value as well as a comparison with similar homes in the area
Home Values in the Area
Average Home Value in this Area
Purchase History
| Date | Buyer | Sale Price | Title Company |
|---|---|---|---|
| Kirby Kenneth | $515,000 | Assure Title & Escrow Llc | |
| Kirby Kenneth | $515,000 | Assure Title & Escrow Llc | |
| Buffalo Valley Inc | -- | -- | |
| Buffalo Valley Inc | -- | -- | |
| Buffalo Valley Inc | -- | -- | |
| Buffalo Valley Inc | $51,000 | -- | |
| Miller Johnny N | $43,750 | -- | |
| -- | $43,800 | -- |
Source: Public Records
Tax History Compared to Growth
Tax History
| Year | Tax Paid | Tax Assessment Tax Assessment Total Assessment is a certain percentage of the fair market value that is determined by local assessors to be the total taxable value of land and additions on the property. | Land | Improvement |
|---|---|---|---|---|
| 2024 | $2,224 | $52,775 | $4,800 | $47,975 |
| 2023 | $2,224 | $52,775 | $0 | $0 |
| 2022 | $1,915 | $52,775 | $4,800 | $47,975 |
| 2021 | $1,843 | $40,250 | $4,000 | $36,250 |
| 2020 | $1,843 | $40,250 | $4,000 | $36,250 |
| 2019 | $1,843 | $40,250 | $4,000 | $36,250 |
| 2018 | $1,843 | $40,250 | $4,000 | $36,250 |
| 2017 | $1,840 | $35,075 | $4,000 | $31,075 |
| 2016 | $1,840 | $35,075 | $4,000 | $31,075 |
| 2015 | $1,840 | $35,075 | $4,000 | $31,075 |
| 2014 | $1,840 | $35,075 | $0 | $0 |
Source: Public Records
Map
Nearby Homes