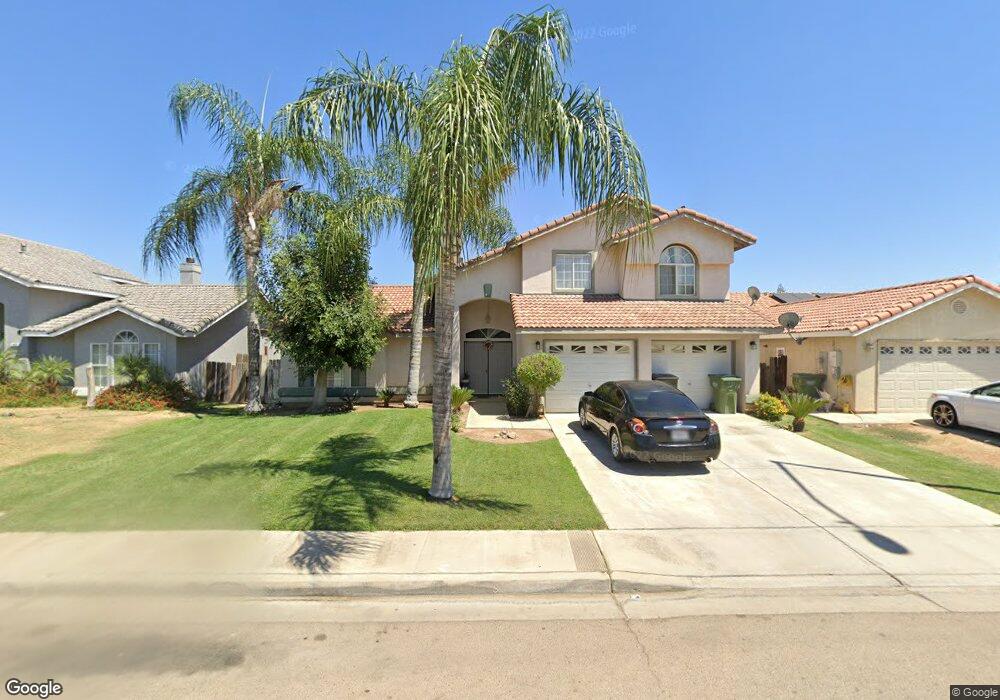
414 Red Robin Dr Dinuba, CA 93618
Estimated Value: $370,000 - $409,000
4
Beds
3
Baths
1,993
Sq Ft
$199/Sq Ft
Est. Value
About This Home
This home is located at 414 Red Robin Dr, Dinuba, CA 93618 and is currently estimated at $397,366, approximately $199 per square foot. 414 Red Robin Dr is a home located in Tulare County with nearby schools including Grand View Elementary School, Washington Intermediate School, and Dinuba High School.
Ownership History
Date
Name
Owned For
Owner Type
Purchase Details
Closed on
Apr 19, 2003
Sold by
Garibay Francisco J and Garibay Maria D
Bought by
Martinez Jose and Martinez Rosa
Current Estimated Value
Purchase Details
Closed on
Mar 6, 2000
Sold by
Fresno Aspen Development
Bought by
Garibay Francisco J and Garibay Maria D
Home Financials for this Owner
Home Financials are based on the most recent Mortgage that was taken out on this home.
Original Mortgage
$109,000
Interest Rate
8.37%
Create a Home Valuation Report for This Property
The Home Valuation Report is an in-depth analysis detailing your home's value as well as a comparison with similar homes in the area
Home Values in the Area
Average Home Value in this Area
Purchase History
| Date | Buyer | Sale Price | Title Company |
|---|---|---|---|
| Martinez Jose | $163,500 | Chicago Title Co | |
| Garibay Francisco J | $142,500 | Chicago Title Co |
Source: Public Records
Mortgage History
| Date | Status | Borrower | Loan Amount |
|---|---|---|---|
| Previous Owner | Garibay Francisco J | $109,000 |
Source: Public Records
Tax History
| Year | Tax Paid | Tax Assessment Tax Assessment Total Assessment is a certain percentage of the fair market value that is determined by local assessors to be the total taxable value of land and additions on the property. | Land | Improvement |
|---|---|---|---|---|
| 2025 | $2,672 | $236,807 | $43,449 | $193,358 |
| 2024 | $2,672 | $232,165 | $42,598 | $189,567 |
| 2023 | $2,635 | $227,613 | $41,763 | $185,850 |
| 2022 | $2,511 | $223,151 | $40,945 | $182,206 |
| 2021 | $2,448 | $218,775 | $40,142 | $178,633 |
| 2020 | $2,488 | $216,531 | $39,730 | $176,801 |
| 2019 | $2,518 | $212,285 | $38,951 | $173,334 |
| 2018 | $2,439 | $208,122 | $38,187 | $169,935 |
| 2017 | $2,417 | $204,041 | $37,438 | $166,603 |
| 2016 | $2,377 | $200,040 | $36,704 | $163,336 |
| 2015 | $2,035 | $197,000 | $49,000 | $148,000 |
| 2014 | $2,035 | $172,000 | $43,000 | $129,000 |
Source: Public Records
Map
Nearby Homes
- 553 Venice Ave
- 7116 Avenue 416
- 1775 Palmer Ave
- 762 S Plum Ct
- 42162 Road 72
- 42682 Road 72
- 762 Apple St
- 788 Apple St
- 372 N Smith Ave
- 1695 Rosemary Ave Unit Mb61
- 1787 Rosemary Ave Unit Mb67
- 1815 Rosemary Ave Unit Mb69
- 1863 Rosemary Ave Unit Mb71
- 784 Rivera St
- 900 Heather Ave
- 1739 W Vallejo Ave
- 1682 W Vallejo
- 0 Avenue 424
- 7301 Avenue 424
- 1306 Country Place
- 430 Red Robin Dr
- 398 Red Robin Dr
- 413 Quail Run Dr
- 429 Quail Run Dr
- 382 Red Robin Dr
- 446 Red Robin Dr
- 397 Quail Run Dr
- 411 Red Robin Dr
- 395 Red Robin Dr
- 350 Red Robin Dr
- 427 Red Robin Dr
- 365 Quail Run Dr
- 379 Red Robin Dr
- 443 Red Robin Dr
- 347 Red Robin Dr
- 412 N Morningside Dr
- 418 Quail Run Dr
- 396 N Morningside Dr
- 402 Quail Run Dr
- 428 N Morningside Dr
Your Personal Tour Guide
Ask me questions while you tour the home.