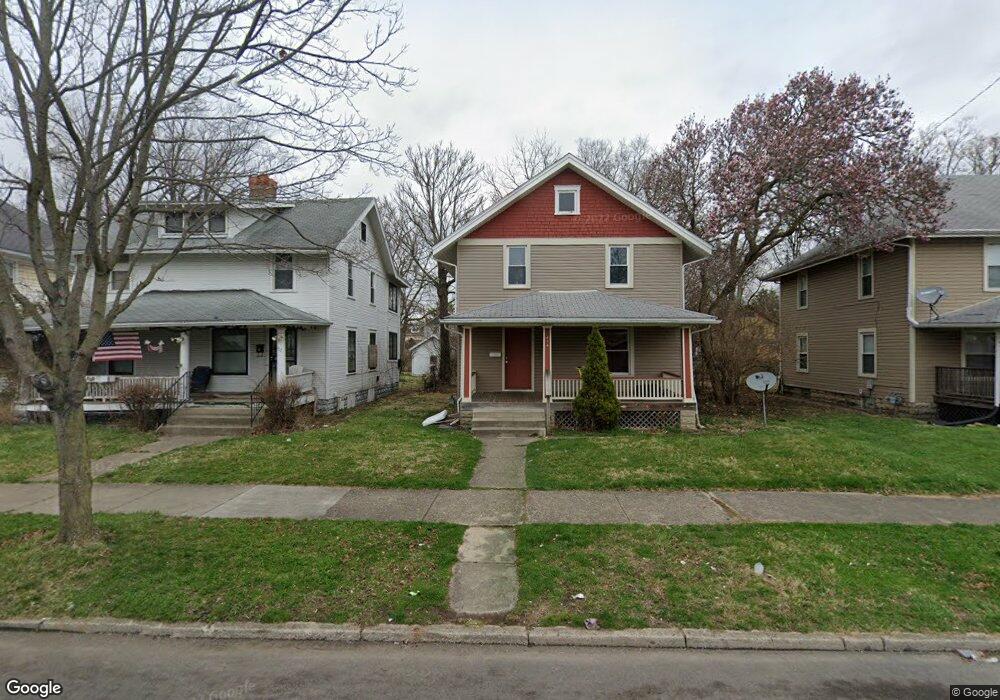
414 W Euclid Ave Springfield, OH 45506
Estimated Value: $66,000 - $98,000
3
Beds
1
Bath
1,380
Sq Ft
$58/Sq Ft
Est. Value
About This Home
This home is located at 414 W Euclid Ave, Springfield, OH 45506 and is currently estimated at $79,562, approximately $57 per square foot. 414 W Euclid Ave is a home located in Clark County with nearby schools including Fulton Elementary School, Hayward Middle School, and Springfield High School.
Ownership History
Date
Name
Owned For
Owner Type
Purchase Details
Closed on
Mar 17, 2011
Sold by
Home City Federal Savings Bank
Bought by
Garlind Properties Ltd
Current Estimated Value
Home Financials for this Owner
Home Financials are based on the most recent Mortgage that was taken out on this home.
Original Mortgage
$138,195
Outstanding Balance
$96,064
Interest Rate
5.04%
Mortgage Type
Future Advance Clause Open End Mortgage
Estimated Equity
-$16,502
Purchase Details
Closed on
Jan 25, 2011
Sold by
Johncar Investments Llc
Bought by
Home City Federal Savings Bank
Home Financials for this Owner
Home Financials are based on the most recent Mortgage that was taken out on this home.
Original Mortgage
$138,195
Outstanding Balance
$96,064
Interest Rate
5.04%
Mortgage Type
Future Advance Clause Open End Mortgage
Estimated Equity
-$16,502
Purchase Details
Closed on
Mar 24, 2006
Sold by
Hubbard William W and Hubbard Jeannie M
Bought by
Johncar Investments Llc
Purchase Details
Closed on
Jul 16, 2002
Sold by
Carey Norman C
Bought by
Hubbard William
Create a Home Valuation Report for This Property
The Home Valuation Report is an in-depth analysis detailing your home's value as well as a comparison with similar homes in the area
Home Values in the Area
Average Home Value in this Area
Purchase History
| Date | Buyer | Sale Price | Title Company |
|---|---|---|---|
| Garlind Properties Ltd | $90,600 | None Available | |
| Home City Federal Savings Bank | $66,700 | None Available | |
| Johncar Investments Llc | $239,600 | None Available | |
| Hubbard William | $16,500 | -- |
Source: Public Records
Mortgage History
| Date | Status | Borrower | Loan Amount |
|---|---|---|---|
| Open | Garlind Properties Ltd | $138,195 |
Source: Public Records
Tax History Compared to Growth
Tax History
| Year | Tax Paid | Tax Assessment Tax Assessment Total Assessment is a certain percentage of the fair market value that is determined by local assessors to be the total taxable value of land and additions on the property. | Land | Improvement |
|---|---|---|---|---|
| 2024 | $781 | $15,810 | $1,470 | $14,340 |
| 2023 | $781 | $15,810 | $1,470 | $14,340 |
| 2022 | $800 | $15,810 | $1,470 | $14,340 |
| 2021 | $718 | $13,060 | $1,210 | $11,850 |
| 2020 | $719 | $13,060 | $1,210 | $11,850 |
| 2019 | $721 | $13,060 | $1,210 | $11,850 |
| 2018 | $633 | $11,010 | $940 | $10,070 |
| 2017 | $633 | $11,008 | $938 | $10,070 |
| 2016 | $634 | $11,008 | $938 | $10,070 |
| 2015 | $646 | $11,008 | $938 | $10,070 |
| 2014 | $643 | $11,008 | $938 | $10,070 |
| 2013 | $637 | $11,008 | $938 | $10,070 |
Source: Public Records
Map
Nearby Homes
- 326 W Grand Ave
- 416 W Southern Ave
- 506 W Southern Ave
- 409 W Southern Ave
- 424 W State St
- 329 Fair St
- 642 W Euclid Ave
- 702 S Wittenberg Ave
- 516 W Clark St
- 924 W State St
- 427 Rosewood Ave
- 738 S Center St Unit 740
- 830 Dibert Ave
- 525 S Light St
- 1029 S Fountain Ave
- 1361 Woodward Ave
- 929 S Western Ave
- 1603 W Wittenberg Blvd
- 540 Mead Ln
- 711 W Mulberry St
- 420 W Euclid Ave
- 406 W Euclid Ave Unit 408
- 408 W Euclid Ave
- 422 W Euclid Ave
- 402 W Euclid Ave Unit 404
- 426 W Euclid Ave
- 411 W Liberty St
- 409 W Liberty St
- 417 W Liberty St
- 405 W Liberty St
- 421 W Liberty St
- 401 W Liberty St
- 425 W Liberty St
- 411 W Euclid Ave
- 427 W Euclid Ave
- 409 W Euclid Ave
- 350 W Euclid Ave
- 429 W Liberty St
- 435 W Euclid Ave
- 405 W Euclid Ave