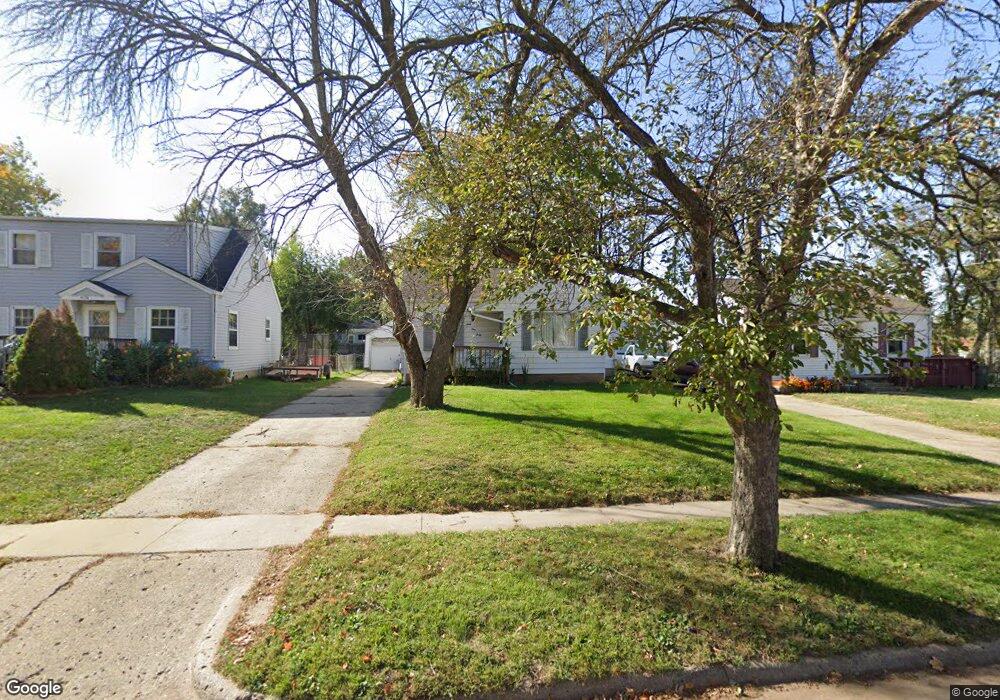
4140 1st St Des Moines, IA 50313
Highland Park NeighborhoodEstimated Value: $138,000 - $176,000
2
Beds
1
Bath
708
Sq Ft
$224/Sq Ft
Est. Value
About This Home
This home is located at 4140 1st St, Des Moines, IA 50313 and is currently estimated at $158,667, approximately $224 per square foot. 4140 1st St is a home located in Polk County with nearby schools including Madison Elementary School, Harding Middle School, and North High School.
Ownership History
Date
Name
Owned For
Owner Type
Purchase Details
Closed on
Dec 22, 2022
Sold by
Community Improvement Group Inc
Bought by
Cam 2022 Llc
Current Estimated Value
Home Financials for this Owner
Home Financials are based on the most recent Mortgage that was taken out on this home.
Original Mortgage
$120,000
Outstanding Balance
$116,169
Interest Rate
6.61%
Mortgage Type
Construction
Estimated Equity
$42,498
Purchase Details
Closed on
Jan 5, 2019
Sold by
Luke Colin Gene
Bought by
Luke Barbara
Create a Home Valuation Report for This Property
The Home Valuation Report is an in-depth analysis detailing your home's value as well as a comparison with similar homes in the area
Home Values in the Area
Average Home Value in this Area
Purchase History
| Date | Buyer | Sale Price | Title Company |
|---|---|---|---|
| Cam 2022 Llc | $79,000 | -- | |
| Cam 2022 Llc | $79,000 | None Listed On Document | |
| Community Improvement Group Inc | $60,000 | -- | |
| Luke Barbara | -- | Change Of Title |
Source: Public Records
Mortgage History
| Date | Status | Borrower | Loan Amount |
|---|---|---|---|
| Open | Cam 2022 Llc | $120,000 | |
| Closed | Cam 2022 Llc | $120,000 |
Source: Public Records
Tax History
| Year | Tax Paid | Tax Assessment Tax Assessment Total Assessment is a certain percentage of the fair market value that is determined by local assessors to be the total taxable value of land and additions on the property. | Land | Improvement |
|---|---|---|---|---|
| 2025 | $1,996 | $115,400 | $31,800 | $83,600 |
| 2024 | $1,996 | $101,500 | $27,500 | $74,000 |
| 2023 | $2,210 | $101,500 | $27,500 | $74,000 |
| 2022 | $2,190 | $106,000 | $24,000 | $82,000 |
| 2021 | $2,020 | $106,000 | $24,000 | $82,000 |
| 2020 | $2,090 | $92,800 | $20,900 | $71,900 |
| 2019 | $1,876 | $92,800 | $20,900 | $71,900 |
| 2018 | $1,850 | $81,600 | $18,100 | $63,500 |
| 2017 | $1,712 | $81,600 | $18,100 | $63,500 |
| 2016 | $1,662 | $75,100 | $16,300 | $58,800 |
| 2015 | $1,662 | $75,100 | $16,300 | $58,800 |
| 2014 | $1,694 | $78,500 | $16,700 | $61,800 |
Source: Public Records
Map
Nearby Homes
- 4108 3rd St
- 355 NW Aurora Ave
- 4117 5th Ave
- 360 NE Aurora Ave
- 3938 1st St
- 380 NE 43rd Ave
- 4012 Bowdoin St
- 4033 7th St
- 3905 Cambridge St
- 3837 3rd St
- 4012 Amherst St
- 4013 8th St
- 3832 Bowdoin St
- 3814 Columbia St
- 3911 8th St
- 425 NE Broadway Ave
- 3803 Bowdoin St
- 3615 Cambridge St
- 3633 Bowdoin St
- 3916 9th St
Your Personal Tour Guide
Ask me questions while you tour the home.