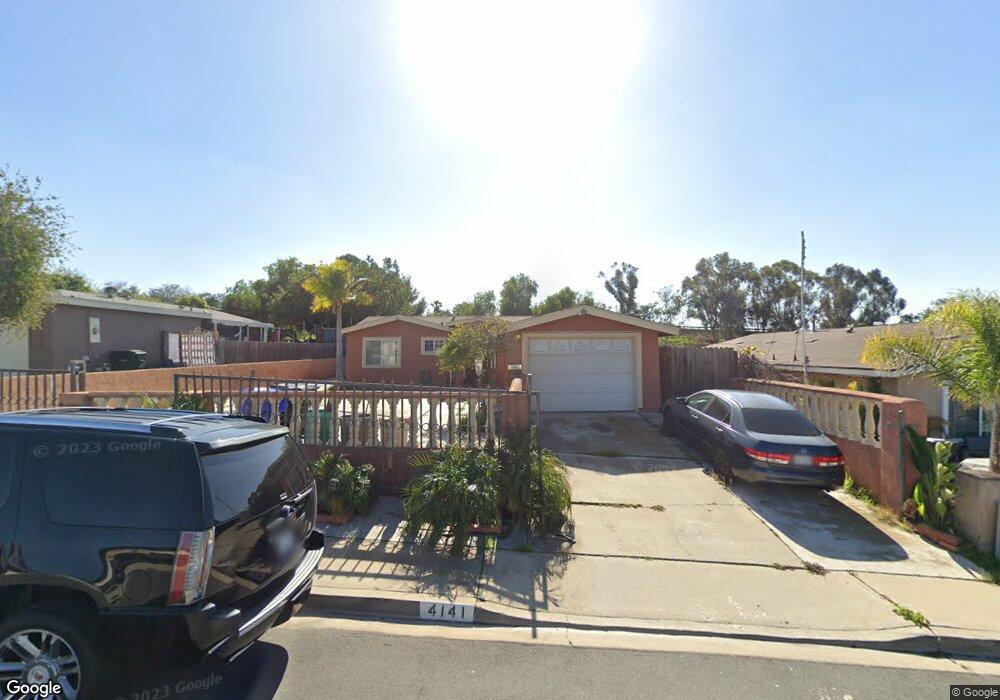
4141 Alcorn St San Diego, CA 92154
Otay Mesa West NeighborhoodEstimated Value: $751,092 - $843,000
3
Beds
2
Baths
1,605
Sq Ft
$487/Sq Ft
Est. Value
About This Home
This home is located at 4141 Alcorn St, San Diego, CA 92154 and is currently estimated at $782,273, approximately $487 per square foot. 4141 Alcorn St is a home located in San Diego County with nearby schools including Los Altos Elementary School, Montgomery Middle School, and Montgomery Senior High School.
Ownership History
Date
Name
Owned For
Owner Type
Purchase Details
Closed on
Feb 3, 2016
Sold by
Lomeli Jesus Lopez
Bought by
Lopez Margarita Angelica
Current Estimated Value
Purchase Details
Closed on
Aug 20, 2011
Sold by
Lopez Guadalupe
Bought by
Lomeli Jesus Lopez
Purchase Details
Closed on
Mar 1, 2010
Sold by
Lomell Jesus Lopez and Lopez Carmen H
Bought by
Lomeli Jesus Lopez and Lopez Guadalupe
Purchase Details
Closed on
Oct 26, 2006
Sold by
Lopez Carmen H
Bought by
Lomeli Jesus Lopez
Home Financials for this Owner
Home Financials are based on the most recent Mortgage that was taken out on this home.
Original Mortgage
$137,000
Interest Rate
6.36%
Mortgage Type
New Conventional
Purchase Details
Closed on
Oct 25, 2006
Sold by
Lomeli Jesus Lopez
Bought by
Lomeli Jesus Lopez and Lopez Carmen H
Home Financials for this Owner
Home Financials are based on the most recent Mortgage that was taken out on this home.
Original Mortgage
$137,000
Interest Rate
6.36%
Mortgage Type
New Conventional
Create a Home Valuation Report for This Property
The Home Valuation Report is an in-depth analysis detailing your home's value as well as a comparison with similar homes in the area
Home Values in the Area
Average Home Value in this Area
Purchase History
| Date | Buyer | Sale Price | Title Company |
|---|---|---|---|
| Lopez Margarita Angelica | -- | None Available | |
| Lomeli Jesus Lopez | -- | None Available | |
| Lomeli Jesus Lopez | -- | Lawyers Title Sd | |
| Lomeli Jesus Lopez | -- | Southland Title | |
| Lomeli Jesus Lopez | -- | Accommodation |
Source: Public Records
Mortgage History
| Date | Status | Borrower | Loan Amount |
|---|---|---|---|
| Previous Owner | Lomeli Jesus Lopez | $137,000 |
Source: Public Records
Tax History Compared to Growth
Tax History
| Year | Tax Paid | Tax Assessment Tax Assessment Total Assessment is a certain percentage of the fair market value that is determined by local assessors to be the total taxable value of land and additions on the property. | Land | Improvement |
|---|---|---|---|---|
| 2025 | $1,651 | $140,374 | $43,003 | $97,371 |
| 2024 | $1,651 | $137,622 | $42,160 | $95,462 |
| 2023 | $1,627 | $134,925 | $41,334 | $93,591 |
| 2022 | $1,581 | $132,280 | $40,524 | $91,756 |
| 2021 | $1,545 | $129,687 | $39,730 | $89,957 |
| 2020 | $1,509 | $128,358 | $39,323 | $89,035 |
| 2019 | $1,470 | $125,842 | $38,552 | $87,290 |
| 2018 | $1,448 | $123,376 | $37,797 | $85,579 |
| 2017 | $1,417 | $120,957 | $37,056 | $83,901 |
| 2016 | $1,304 | $118,586 | $36,330 | $82,256 |
| 2015 | $1,284 | $116,806 | $35,785 | $81,021 |
| 2014 | $1,262 | $114,519 | $35,085 | $79,434 |
Source: Public Records
Map
Nearby Homes
- 4151 Alcorn St
- 150 Diza Rd
- 3844 Via Del Bardo
- 3903 Via Del Bardo
- 1819 Smythe Ave Unit 73
- 1185 Ransom St
- 127 Avenida de la Madrid
- 1564 Smythe Ave
- 3754 Shooting Star Dr
- 4325 Darwin Way
- 1378 Starry Way
- 3971 Caseman Ave
- 1697 Shooting Star Ct
- 3679 Rosa Linda St
- 1568 Coporate Center Drive & Otay Mesa Rd Unit 12,13,14
- 3498 Agosto St
- 0 Future Airway Rd Unit Tr 1267 Lot 27
- 1756 Via Del Tanido
- 3414 Del Sol Blvd Unit A
- 3474 Del Sol Blvd Unit C
- 4131 Alcorn St
- 4121 Alcorn St
- 4161 Alcorn St
- 4171 Alcorn St
- 4113 Alcorn St
- 4181 Alcorn St
- 4144 Alcorn St
- 4134 Alcorn St
- 4105 Alcorn St
- 4154 Alcorn St
- 4124 Alcorn St
- 1541 Peterlynn Dr
- 4164 Alcorn St
- 4097 Alcorn St
- 4191 Alcorn St
- 4174 Alcorn St
- 1529 Peterlynn Dr
- 4184 Alcorn St
- 4205 Alcorn St
- 4085 Alcorn St