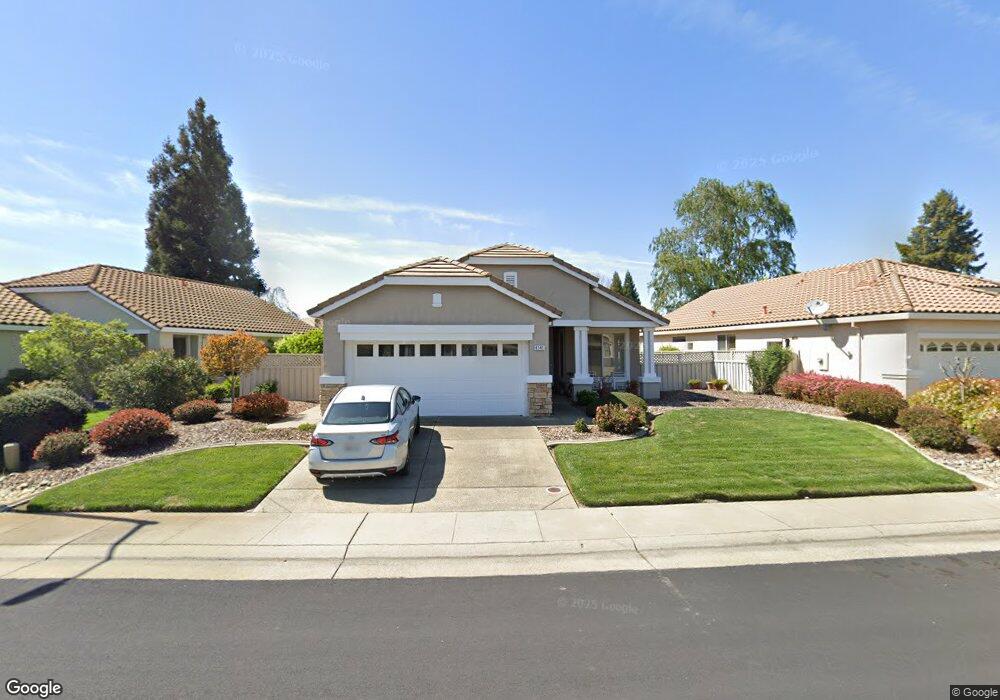
4141 Napa Loop Unit 2EI Roseville, CA 95747
Sun City NeighborhoodEstimated Value: $496,543 - $552,000
2
Beds
2
Baths
1,323
Sq Ft
$391/Sq Ft
Est. Value
About This Home
This home is located at 4141 Napa Loop Unit 2EI, Roseville, CA 95747 and is currently estimated at $517,136, approximately $390 per square foot. 4141 Napa Loop Unit 2EI is a home located in Placer County with nearby schools including Quail Glen Elementary School, Silverado Middle School, and Woodcreek High School.
Ownership History
Date
Name
Owned For
Owner Type
Purchase Details
Closed on
Oct 27, 2020
Sold by
Catherine Mary
Bought by
Catherine Mary and Stinson Stephen J
Current Estimated Value
Purchase Details
Closed on
Sep 18, 2003
Sold by
Allured Arlene S and Allured John W
Bought by
Catherine Mary
Home Financials for this Owner
Home Financials are based on the most recent Mortgage that was taken out on this home.
Original Mortgage
$148,000
Outstanding Balance
$68,563
Interest Rate
6.22%
Mortgage Type
Purchase Money Mortgage
Estimated Equity
$448,573
Purchase Details
Closed on
May 20, 2002
Sold by
Allured Arlene S
Bought by
Allured Arlene S
Purchase Details
Closed on
Aug 12, 1997
Sold by
Del Webb California Corp
Bought by
Allured Arlene S
Create a Home Valuation Report for This Property
The Home Valuation Report is an in-depth analysis detailing your home's value as well as a comparison with similar homes in the area
Home Values in the Area
Average Home Value in this Area
Purchase History
| Date | Buyer | Sale Price | Title Company |
|---|---|---|---|
| Catherine Mary | -- | None Available | |
| Catherine Mary | $260,000 | Sierra Valley Title | |
| Allured Arlene S | -- | -- | |
| Allured Arlene S | $149,500 | First American Title Co |
Source: Public Records
Mortgage History
| Date | Status | Borrower | Loan Amount |
|---|---|---|---|
| Open | Catherine Mary | $148,000 |
Source: Public Records
Tax History
| Year | Tax Paid | Tax Assessment Tax Assessment Total Assessment is a certain percentage of the fair market value that is determined by local assessors to be the total taxable value of land and additions on the property. | Land | Improvement |
|---|---|---|---|---|
| 2025 | $3,807 | $369,649 | $127,952 | $241,697 |
| 2023 | $3,807 | $355,297 | $122,985 | $232,312 |
| 2022 | $3,772 | $348,331 | $120,574 | $227,757 |
| 2021 | $3,792 | $341,502 | $118,210 | $223,292 |
| 2020 | $3,764 | $338,001 | $116,998 | $221,003 |
| 2019 | $3,711 | $331,374 | $114,704 | $216,670 |
| 2018 | $3,576 | $324,877 | $112,455 | $212,422 |
| 2017 | $3,524 | $318,507 | $110,250 | $208,257 |
| 2016 | $3,432 | $312,263 | $108,089 | $204,174 |
| 2015 | $3,369 | $307,574 | $106,466 | $201,108 |
| 2014 | $3,196 | $291,000 | $100,700 | $190,300 |
Source: Public Records
Map
Nearby Homes
- 109 Wild Oat Ct
- 5244 Sugar Pine Loop
- 309 Sugar Loaf Ct
- 5284 Sugar Pine Loop
- 412 Shiveley Ct
- 1417 Calle Las Casas
- 5194 Green Grove Ln
- 200 Saddlebag Ct
- 325 Savannah Ct
- 5757 Sandlewood Way
- 6030 Timberlodge Ln
- 6014 Timberlodge Ln
- 1900 Avenida Martina
- 348 Ainsdale Ct
- 1728 Blackbird St
- 1756 Camino Real Way
- 4554 Wanderlust Loop
- 1617 Blackbird St
- 7127 Lyne Bay Dr
- 4796 Mount Rose Way
- 4157 Napa Loop
- 232 Trolleybell Ct
- 4165 Napa Loop
- 4125 Napa Loop
- 224 Trolleybell Ct
- 4140 Napa Loop
- 4173 Napa Loop
- 4156 Napa Loop
- 4132 Napa Loop
- 4117 Napa Loop
- 240 Trolleybell Ct
- 4164 Napa Loop
- 4124 Napa Loop
- 4116 Napa Loop
- 4109 Napa Loop
- 4172 Napa Loop
- 4213 Napa Loop
- 4221 Napa Loop
- 208 Trolleybell Ct
- 1538 Steinbeck Dr
Your Personal Tour Guide
Ask me questions while you tour the home.