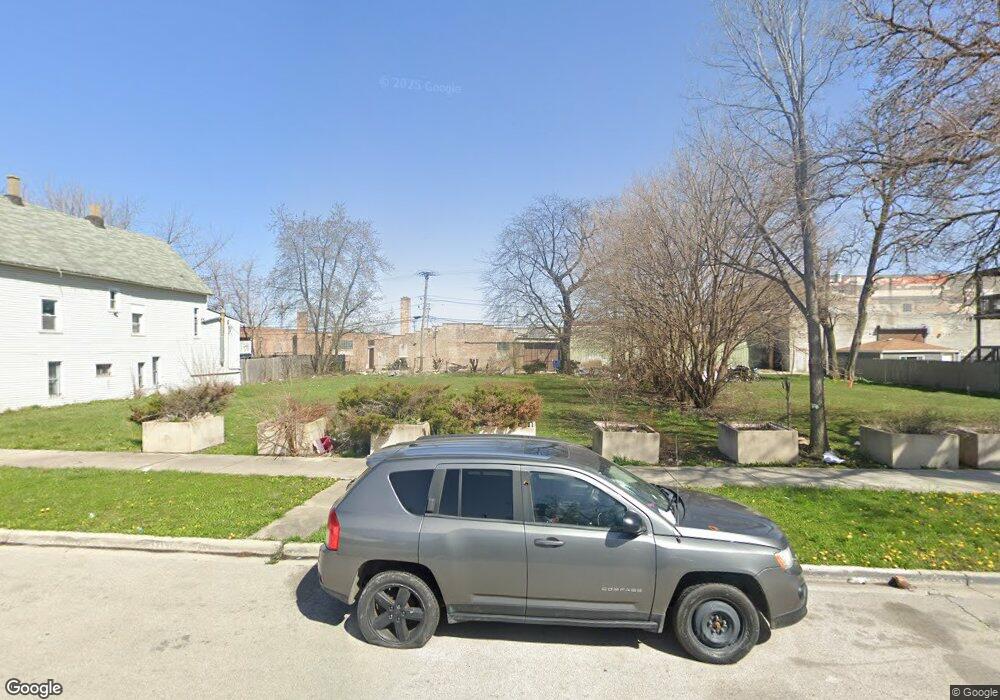
4142 W Carroll Ave Chicago, IL 60624
Garfield Park NeighborhoodEstimated Value: $214,000
6
Beds
3
Baths
774
Sq Ft
$276/Sq Ft
Est. Value
About This Home
This home is located at 4142 W Carroll Ave, Chicago, IL 60624 and is currently estimated at $214,000, approximately $276 per square foot. 4142 W Carroll Ave is a home located in Cook County with nearby schools including Tilton Elementary School, Orr Academy High School, and KIPP One Academy.
Ownership History
Date
Name
Owned For
Owner Type
Purchase Details
Closed on
Jul 15, 2011
Sold by
American Home Mortgage Servicing Inc
Bought by
Atlantic Coast Houses Llc
Current Estimated Value
Purchase Details
Closed on
Jan 8, 2008
Sold by
Witek Joseph
Bought by
American Home Mortgage Servicing Inc
Purchase Details
Closed on
Dec 21, 2004
Sold by
Simmons Elizabeth
Bought by
Witek Joseph
Home Financials for this Owner
Home Financials are based on the most recent Mortgage that was taken out on this home.
Original Mortgage
$144,000
Interest Rate
5.78%
Mortgage Type
Unknown
Purchase Details
Closed on
Jul 28, 1995
Sold by
Simmons Rita Laverne
Bought by
Simmons Elizabeth
Purchase Details
Closed on
Apr 20, 1994
Sold by
Simmons Thomas J and Simmons Elizabeth
Bought by
Simmons Rita Laverne
Create a Home Valuation Report for This Property
The Home Valuation Report is an in-depth analysis detailing your home's value as well as a comparison with similar homes in the area
Home Values in the Area
Average Home Value in this Area
Purchase History
| Date | Buyer | Sale Price | Title Company |
|---|---|---|---|
| Atlantic Coast Houses Llc | $8,970 | None Available | |
| American Home Mortgage Servicing Inc | -- | None Available | |
| Witek Joseph | $160,000 | Heritage Title Company | |
| Simmons Elizabeth | -- | -- | |
| Simmons Rita Laverne | -- | -- |
Source: Public Records
Mortgage History
| Date | Status | Borrower | Loan Amount |
|---|---|---|---|
| Previous Owner | Witek Joseph | $144,000 |
Source: Public Records
Tax History
| Year | Tax Paid | Tax Assessment Tax Assessment Total Assessment is a certain percentage of the fair market value that is determined by local assessors to be the total taxable value of land and additions on the property. | Land | Improvement |
|---|---|---|---|---|
| 2025 | $777 | $4,531 | $4,531 | -- |
| 2024 | $777 | $4,531 | $4,531 | -- |
| 2023 | $758 | $3,672 | $3,672 | -- |
| 2022 | $758 | $3,672 | $3,672 | $0 |
| 2021 | $741 | $3,671 | $3,671 | $0 |
| 2020 | $821 | $3,671 | $3,671 | $0 |
| 2019 | $740 | $3,671 | $3,671 | $0 |
| 2018 | $728 | $3,671 | $3,671 | $0 |
| 2017 | $709 | $3,281 | $3,281 | $0 |
| 2016 | $657 | $3,281 | $3,281 | $0 |
| 2015 | $601 | $3,281 | $3,281 | $0 |
| 2014 | $580 | $3,125 | $3,125 | $0 |
| 2013 | $568 | $3,125 | $3,125 | $0 |
Source: Public Records
Map
Nearby Homes
- 4216 W West End Ave
- 4321 W Maypole Ave
- 442 N Harding Ave
- 445 N Harding Ave
- 217 N Kostner Ave
- 4244 W Washington Blvd
- 4407 W Maypole Ave
- 4016 W Washington Blvd
- 334 N Avers Ave
- 4123 W Washington Blvd
- 4432 W Maypole Ave
- 4357 W End Ave
- 1-15 N Keeler Ave
- 3824 W Fulton St
- 257 N Kilbourn Ave
- 525 N Springfield Ave
- 4153 W Madison St
- 4501 W Maypole Ave
- 559 N Springfield Ave
- 3829 W Maypole Ave
- 4150 W Carroll Ave
- 4150 W Carroll Ave
- 4152 W Carroll Ave
- 4134 W Carroll Ave Unit 2
- 4134 W Carroll Ave
- 4151 W Carroll Ave
- 4151 W Carroll Ave
- 4145 W Kinzie St
- 4145 W Carroll Ave
- 4143 W Carroll Ave
- 4131 W Carroll Ave
- 4135 W Carroll Ave
- 4157 W Carroll Ave
- 4133 W Carroll Ave
- 4122 W Carroll Ave
- 4205 W Carroll Ave
- 4206 W Carroll Ave
- 4114 W Carroll Ave
- 4114 W Carroll Ave
- 4207 W Carroll Ave Unit 2
Your Personal Tour Guide
Ask me questions while you tour the home.