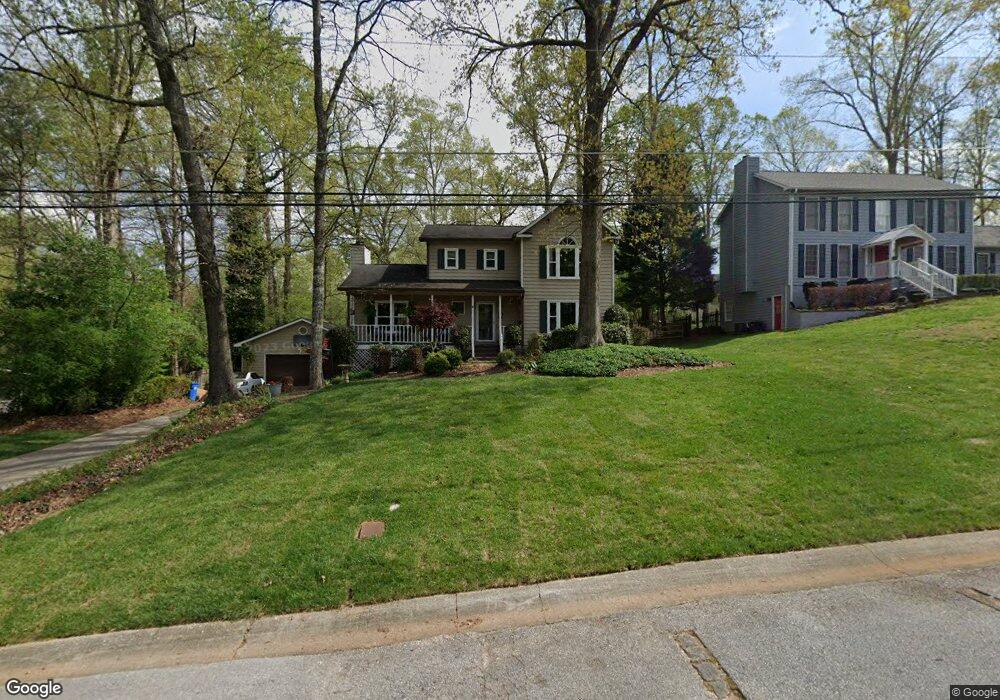
4142 Willow Walk SW Lilburn, GA 30047
Estimated Value: $386,000 - $440,000
3
Beds
3
Baths
1,878
Sq Ft
$215/Sq Ft
Est. Value
About This Home
This home is located at 4142 Willow Walk SW, Lilburn, GA 30047 and is currently estimated at $404,100, approximately $215 per square foot. 4142 Willow Walk SW is a home located in Gwinnett County with nearby schools including Head Elementary School, Five Forks Middle School, and Brookwood High School.
Ownership History
Date
Name
Owned For
Owner Type
Purchase Details
Closed on
Feb 18, 2003
Sold by
Shaffer Michael R
Bought by
Shaffer Susan S
Current Estimated Value
Home Financials for this Owner
Home Financials are based on the most recent Mortgage that was taken out on this home.
Original Mortgage
$130,800
Interest Rate
5.95%
Mortgage Type
New Conventional
Purchase Details
Closed on
Jan 29, 1999
Sold by
Shaffer Michael R and Shaffer Sikes, S
Bought by
Shaffer Shaffer M and Shaffer Susan S
Home Financials for this Owner
Home Financials are based on the most recent Mortgage that was taken out on this home.
Original Mortgage
$130,450
Interest Rate
6.85%
Mortgage Type
FHA
Purchase Details
Closed on
Feb 6, 1997
Sold by
Kazmer Randy Debra
Bought by
Shaffer Michael and Sikes Susan
Create a Home Valuation Report for This Property
The Home Valuation Report is an in-depth analysis detailing your home's value as well as a comparison with similar homes in the area
Home Values in the Area
Average Home Value in this Area
Purchase History
| Date | Buyer | Sale Price | Title Company |
|---|---|---|---|
| Shaffer Susan S | -- | -- | |
| Shaffer Shaffer M | -- | -- | |
| Shaffer Michael | $134,900 | -- |
Source: Public Records
Mortgage History
| Date | Status | Borrower | Loan Amount |
|---|---|---|---|
| Closed | Shaffer Susan S | $130,800 | |
| Previous Owner | Shaffer Shaffer M | $130,450 | |
| Closed | Shaffer Michael | $0 |
Source: Public Records
Tax History Compared to Growth
Tax History
| Year | Tax Paid | Tax Assessment Tax Assessment Total Assessment is a certain percentage of the fair market value that is determined by local assessors to be the total taxable value of land and additions on the property. | Land | Improvement |
|---|---|---|---|---|
| 2025 | $6,063 | $169,640 | $26,120 | $143,520 |
| 2024 | $5,667 | $154,600 | $26,120 | $128,480 |
| 2023 | $5,667 | $154,160 | $26,400 | $127,760 |
| 2022 | $5,091 | $139,360 | $26,400 | $112,960 |
| 2021 | $3,726 | $99,480 | $16,800 | $82,680 |
| 2020 | $3,748 | $99,480 | $16,800 | $82,680 |
| 2019 | $3,475 | $95,440 | $16,800 | $78,640 |
| 2018 | $3,198 | $87,480 | $14,800 | $72,680 |
| 2016 | $2,804 | $75,640 | $14,800 | $60,840 |
| 2015 | $2,602 | $69,160 | $11,200 | $57,960 |
| 2014 | $2,615 | $69,160 | $11,200 | $57,960 |
Source: Public Records
Map
Nearby Homes
- 1905 Embassy Walk Ln
- 4000 Embassy Way
- 1776 Bear Cave SW
- 3728 Kelin Ct SW
- 3725 Hunting Ridge Dr SW
- 4353 Pond Edge Rd
- 3868 Buckland Dr SW
- 3588 Kelin Ct SW
- 1725 Spindle Top Ct SW
- 2047 Cliffton Terrace
- 1732 Beauregard Dr SW
- 3594 Hedgestone Ln
- 1640 Killian Hill Rd SW
- 1893 Hedgestone Ct
- 4268 Rocky Ledge Way
- 4107 Signal Ridge SW
- 3663 Stonelake Ct SW Unit 1
- 4152 Willow Walk SW
- 4132 Willow Walk SW Unit 1
- 1897 Kensington High St SW
- 4162 Willow Walk SW Unit 1
- 1850 Embassy Walk Ln
- 1860 Embassy Walk Ln
- 4141 Willow Walk SW
- 4151 Willow Walk SW
- 1857 Kensington High St SW
- 1907 Kensington High St SW
- 4122 Willow Walk SW
- 1840 Embassy Walk Ln
- 4172 Willow Walk SW Unit 1
- 1870 Embassy Walk Ln
- 1847 Kensington High St SW
- 3823 Knights Bridge Rd SW
- 1917 Kensington High St SW Unit 1
- 1880 Whispering Willow Way SW
- 4121 Willow Walk SW