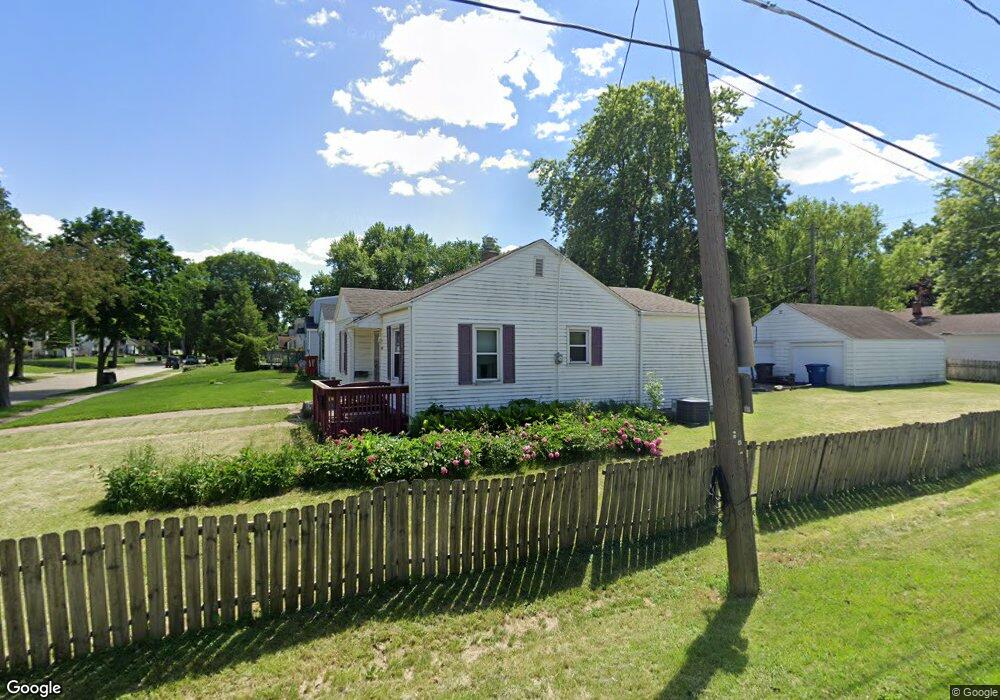
4144 1st St Des Moines, IA 50313
Highland Park NeighborhoodEstimated Value: $173,414 - $189,000
2
Beds
1
Bath
976
Sq Ft
$185/Sq Ft
Est. Value
About This Home
This home is located at 4144 1st St, Des Moines, IA 50313 and is currently estimated at $180,854, approximately $185 per square foot. 4144 1st St is a home located in Polk County with nearby schools including Madison Elementary School, Harding Middle School, and North High School.
Ownership History
Date
Name
Owned For
Owner Type
Purchase Details
Closed on
Aug 16, 2024
Sold by
Hulling Jan R
Bought by
Hlc Llc
Current Estimated Value
Purchase Details
Closed on
May 25, 2024
Sold by
Phyllis J Lacey Living Trust and Hulling Jan R
Bought by
Hulling Jan R
Purchase Details
Closed on
Jan 15, 2021
Sold by
Lacey Phyllis J
Bought by
Phyllis J Lacey Living Trust and Lacey
Purchase Details
Closed on
Jun 16, 2020
Sold by
Lacey Phyllis J and Lacey Mark A
Bought by
Lacey Phyllis J
Create a Home Valuation Report for This Property
The Home Valuation Report is an in-depth analysis detailing your home's value as well as a comparison with similar homes in the area
Home Values in the Area
Average Home Value in this Area
Purchase History
| Date | Buyer | Sale Price | Title Company |
|---|---|---|---|
| Hlc Llc | -- | None Listed On Document | |
| Hulling Jan R | -- | None Listed On Document | |
| Phyllis J Lacey Living Trust | -- | None Listed On Document | |
| Lacey Phyllis J | -- | None Available |
Source: Public Records
Tax History Compared to Growth
Tax History
| Year | Tax Paid | Tax Assessment Tax Assessment Total Assessment is a certain percentage of the fair market value that is determined by local assessors to be the total taxable value of land and additions on the property. | Land | Improvement |
|---|---|---|---|---|
| 2025 | $2,456 | $171,800 | $31,800 | $140,000 |
| 2024 | $2,456 | $151,000 | $27,500 | $123,500 |
| 2023 | $2,732 | $151,000 | $27,500 | $123,500 |
| 2022 | $2,708 | $128,200 | $24,000 | $104,200 |
| 2021 | $2,504 | $128,200 | $24,000 | $104,200 |
| 2020 | $2,594 | $112,200 | $20,900 | $91,300 |
| 2019 | $2,382 | $112,200 | $20,900 | $91,300 |
| 2018 | $2,350 | $100,400 | $18,100 | $82,300 |
| 2017 | $2,168 | $100,400 | $18,100 | $82,300 |
| 2016 | $2,104 | $91,900 | $16,300 | $75,600 |
| 2015 | $2,104 | $91,900 | $16,300 | $75,600 |
| 2014 | $2,170 | $97,100 | $16,700 | $80,400 |
Source: Public Records
Map
Nearby Homes