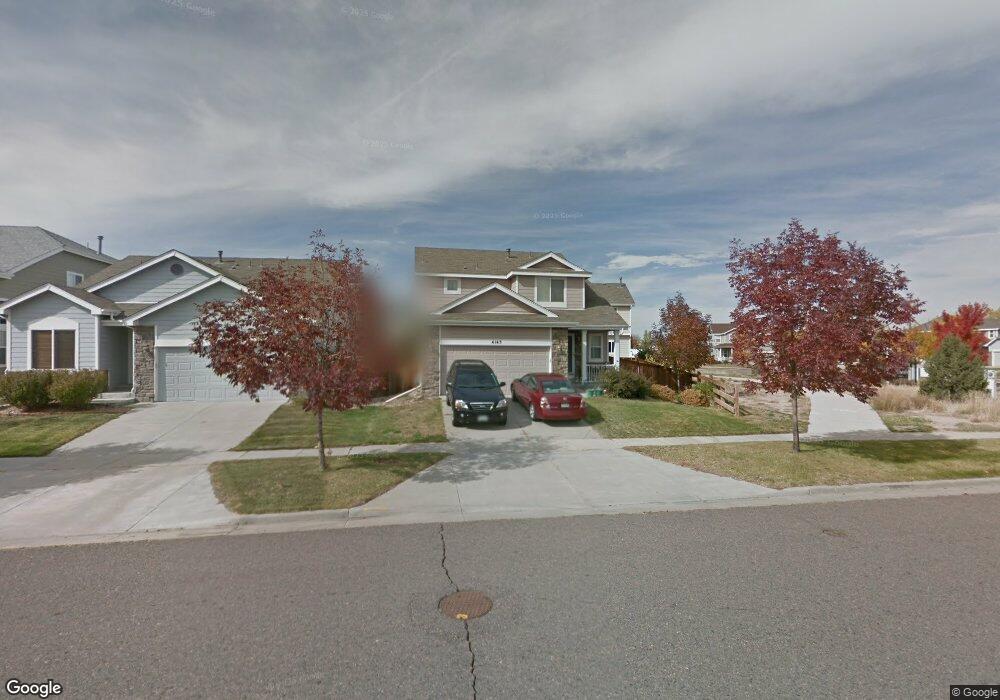
4145 Malaya St Denver, CO 80249
Green Valley Ranch NeighborhoodEstimated Value: $458,000 - $526,000
3
Beds
3
Baths
2,386
Sq Ft
$206/Sq Ft
Est. Value
About This Home
This home is located at 4145 Malaya St, Denver, CO 80249 and is currently estimated at $490,570, approximately $205 per square foot. 4145 Malaya St is a home located in Denver County with nearby schools including Green Valley Elementary School, Pitt-Waller K-8 School, and McGlone Academy.
Ownership History
Date
Name
Owned For
Owner Type
Purchase Details
Closed on
Mar 7, 2019
Sold by
Livingston Christopher Michael and Livingston Christopher M
Bought by
Livingston Christopher Michael
Current Estimated Value
Home Financials for this Owner
Home Financials are based on the most recent Mortgage that was taken out on this home.
Original Mortgage
$355,000
Outstanding Balance
$312,105
Interest Rate
4.4%
Mortgage Type
VA
Estimated Equity
$178,465
Purchase Details
Closed on
Nov 16, 2017
Sold by
Brown Robert L and Brown Angela M
Bought by
Livingston Christopher M
Home Financials for this Owner
Home Financials are based on the most recent Mortgage that was taken out on this home.
Original Mortgage
$315,000
Interest Rate
3.85%
Mortgage Type
VA
Purchase Details
Closed on
Jun 27, 2001
Sold by
Woodcrest Homes Inc
Bought by
Brown Robert L and Brown Angela M
Home Financials for this Owner
Home Financials are based on the most recent Mortgage that was taken out on this home.
Original Mortgage
$146,528
Interest Rate
7.11%
Create a Home Valuation Report for This Property
The Home Valuation Report is an in-depth analysis detailing your home's value as well as a comparison with similar homes in the area
Home Values in the Area
Average Home Value in this Area
Purchase History
| Date | Buyer | Sale Price | Title Company |
|---|---|---|---|
| Livingston Christopher Michael | -- | None Available | |
| Livingston Christopher M | $315,000 | 8 Z Title | |
| Brown Robert L | $183,160 | Land Title |
Source: Public Records
Mortgage History
| Date | Status | Borrower | Loan Amount |
|---|---|---|---|
| Open | Livingston Christopher Michael | $355,000 | |
| Closed | Livingston Christopher M | $315,000 | |
| Previous Owner | Brown Robert L | $146,528 |
Source: Public Records
Tax History Compared to Growth
Tax History
| Year | Tax Paid | Tax Assessment Tax Assessment Total Assessment is a certain percentage of the fair market value that is determined by local assessors to be the total taxable value of land and additions on the property. | Land | Improvement |
|---|---|---|---|---|
| 2024 | $2,905 | $30,810 | $1,780 | $29,030 |
| 2023 | $2,757 | $30,810 | $1,780 | $29,030 |
| 2022 | $2,589 | $25,990 | $4,540 | $21,450 |
| 2021 | $2,532 | $26,730 | $4,670 | $22,060 |
| 2020 | $2,384 | $25,280 | $3,890 | $21,390 |
| 2019 | $2,331 | $25,280 | $3,890 | $21,390 |
| 2018 | $2,058 | $21,120 | $3,130 | $17,990 |
| 2017 | $2,053 | $21,120 | $3,130 | $17,990 |
| 2016 | $1,722 | $16,940 | $3,033 | $13,907 |
| 2015 | $1,664 | $16,940 | $3,033 | $13,907 |
| 2014 | $1,246 | $12,080 | $2,388 | $9,692 |
Source: Public Records
Map
Nearby Homes
- 4304 Malaya St
- 4026 Lisbon St
- 4320 Nepal St
- 21336 E 40th Place
- 20787 E 39th Ave
- 4102 Orleans St
- 21030 E 39th Ave
- 20651 E 42nd Ave
- 20715 E 39th Ave
- 3874 Malta St
- 21303 E 44th Ave
- 20990 E 45th Ave
- 4975 N Perth St
- 20420 Kelly Place
- 21570 E 40th Place
- 20410 Kelly Place
- 20795 E 45th Ave
- 20394 Mitchell Place
- 20604 E 38th Place
- 4054 Perth St
- 4143 Malaya St
- 4144 Lisbon St
- 4146 Lisbon St
- 4141 Malaya St
- 4136 Lisbon St
- 4139 Malaya St
- 4134 Lisbon St
- 4142 Malaya St
- 21004 E 41st Place
- 4126 Lisbon St
- 4137 Malaya St
- 4140 Malaya St
- 4124 Lisbon St
- 4138 Malaya St
- 20999 E 41st Place
- 21034 E 41st Place
- 4135 Malaya St
- 4136 Malaya St
- 21054 E 41st Place
- 4152 Malaya St