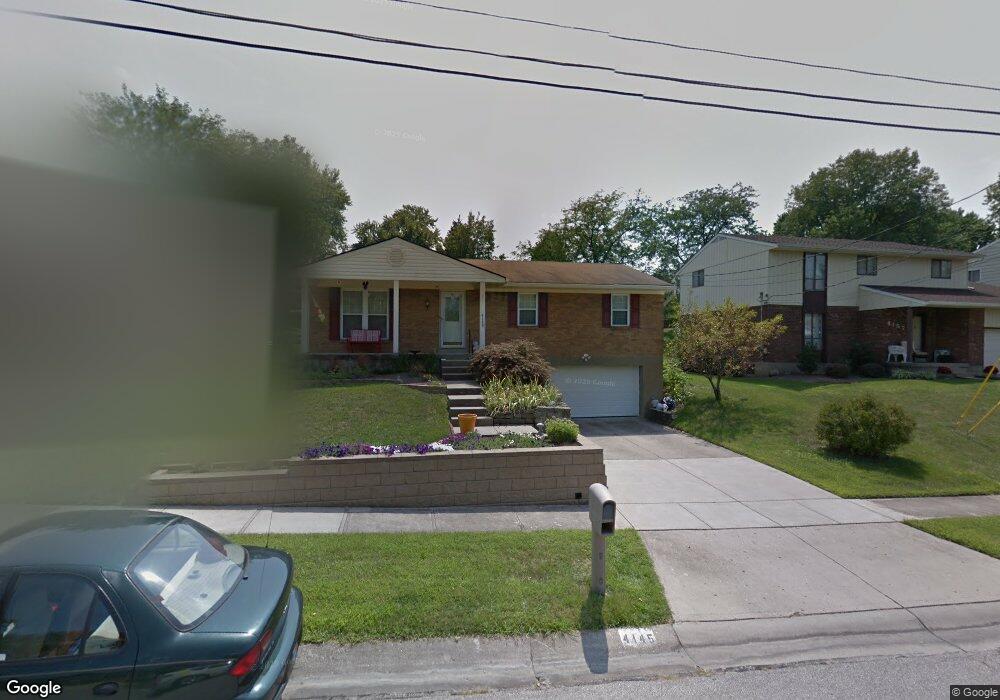
4145 Simca Ln Cincinnati, OH 45211
South Monfort Heights NeighborhoodEstimated Value: $248,000 - $287,000
3
Beds
2
Baths
1,533
Sq Ft
$170/Sq Ft
Est. Value
About This Home
This home is located at 4145 Simca Ln, Cincinnati, OH 45211 and is currently estimated at $260,359, approximately $169 per square foot. 4145 Simca Ln is a home located in Hamilton County with nearby schools including Oakdale Elementary School, Bridgetown Middle School, and Oak Hills High School.
Ownership History
Date
Name
Owned For
Owner Type
Purchase Details
Closed on
Nov 12, 2019
Sold by
Holt Randy J and Holt Julie
Bought by
Holt Randall J and Holt Julie
Current Estimated Value
Home Financials for this Owner
Home Financials are based on the most recent Mortgage that was taken out on this home.
Original Mortgage
$112,000
Interest Rate
4.48%
Mortgage Type
New Conventional
Purchase Details
Closed on
Jun 30, 2005
Sold by
Powers Sharon A
Bought by
Holt Randy and Holt Julie
Home Financials for this Owner
Home Financials are based on the most recent Mortgage that was taken out on this home.
Original Mortgage
$110,000
Interest Rate
5.69%
Mortgage Type
Fannie Mae Freddie Mac
Purchase Details
Closed on
Sep 30, 1997
Sold by
Dehne Steven M and Dehne Peggy H
Bought by
Powers Michael A and Powers Sharon A
Home Financials for this Owner
Home Financials are based on the most recent Mortgage that was taken out on this home.
Original Mortgage
$165,500
Interest Rate
7.54%
Create a Home Valuation Report for This Property
The Home Valuation Report is an in-depth analysis detailing your home's value as well as a comparison with similar homes in the area
Home Values in the Area
Average Home Value in this Area
Purchase History
| Date | Buyer | Sale Price | Title Company |
|---|---|---|---|
| Holt Randall J | -- | None Listed On Document | |
| Holt Randy | $137,500 | Accurate Title Solutions | |
| Powers Michael A | $126,500 | -- |
Source: Public Records
Mortgage History
| Date | Status | Borrower | Loan Amount |
|---|---|---|---|
| Previous Owner | Holt Randall J | $112,000 | |
| Previous Owner | Holt Randy | $110,000 | |
| Previous Owner | Powers Michael A | $165,500 |
Source: Public Records
Tax History
| Year | Tax Paid | Tax Assessment Tax Assessment Total Assessment is a certain percentage of the fair market value that is determined by local assessors to be the total taxable value of land and additions on the property. | Land | Improvement |
|---|---|---|---|---|
| 2025 | $3,660 | $70,200 | $11,827 | $58,373 |
| 2024 | $3,569 | $70,200 | $11,827 | $58,373 |
| 2023 | $3,573 | $70,200 | $11,827 | $58,373 |
| 2022 | $3,246 | $54,065 | $11,512 | $42,553 |
| 2021 | $2,916 | $54,065 | $11,512 | $42,553 |
| 2020 | $2,953 | $54,065 | $11,512 | $42,553 |
| 2019 | $2,890 | $48,273 | $10,280 | $37,993 |
| 2018 | $2,895 | $48,273 | $10,280 | $37,993 |
| 2017 | $2,729 | $48,273 | $10,280 | $37,993 |
| 2016 | $2,605 | $46,005 | $10,182 | $35,823 |
| 2015 | $2,627 | $46,005 | $10,182 | $35,823 |
| 2014 | $2,631 | $46,005 | $10,182 | $35,823 |
| 2013 | $2,483 | $46,466 | $10,283 | $36,183 |
Source: Public Records
Map
Nearby Homes
- 4213 Victorian Green Dr
- 3962 School Section Rd
- 3911 Robinhill Dr
- 4023 Washington Ave
- 3936 Janett Ave
- 4354 Oakville Dr
- 3935 Carrie Ave
- 4105 Trevor Ave
- 4104 Trevor Ave
- 4442 Homelawn Ave
- 4163 Harrison Ave
- 4290 Race Rd
- 3935 Lovell Ave
- 3743 Centurion Dr
- 4324 Marcrest Dr
- 3624 Westwood Northern Blvd
- 3670 Centurion Dr
- 3594 Homelawn Ave
- 4117 N Bend Rd
- 3761 Wilmar Dr
Your Personal Tour Guide
Ask me questions while you tour the home.