41450 Kansas St Unit 4119 Palm Desert, CA 92211
Estimated Value: $394,231 - $465,000
2
Beds
2
Baths
1,360
Sq Ft
$319/Sq Ft
Est. Value
About This Home
This home is located at 41450 Kansas St Unit 4119, Palm Desert, CA 92211 and is currently estimated at $433,558, approximately $318 per square foot. 41450 Kansas St Unit 4119 is a home located in Riverside County with nearby schools including Ronald Reagan Elementary School, Colonel Mitchell Paige Middle School, and Palm Desert High School.
Ownership History
Date
Name
Owned For
Owner Type
Purchase Details
Closed on
Mar 4, 2025
Sold by
Darryl C And Wilma I Hubbard 2000 Trust and Graney Stephanie R
Bought by
Stephanie R Graney Trust and Hubbard
Current Estimated Value
Purchase Details
Closed on
Sep 2, 2003
Sold by
Hubbard Darryl C and Hubbard Wilma I
Bought by
Hubbard Darryl C and Hubbard Wilma I
Purchase Details
Closed on
Dec 6, 2001
Sold by
Marmor Nancy
Bought by
Hubbard Darryl C and Hubbard Wilma I
Home Financials for this Owner
Home Financials are based on the most recent Mortgage that was taken out on this home.
Original Mortgage
$110,000
Interest Rate
7.01%
Purchase Details
Closed on
Jan 11, 2000
Sold by
Freedman Lottie S
Bought by
Freedman Lottie S and The Lottie S Freedman Living Trust
Create a Home Valuation Report for This Property
The Home Valuation Report is an in-depth analysis detailing your home's value as well as a comparison with similar homes in the area
Home Values in the Area
Average Home Value in this Area
Purchase History
| Date | Buyer | Sale Price | Title Company |
|---|---|---|---|
| Stephanie R Graney Trust | -- | None Listed On Document | |
| Hubbard Darryl C | -- | -- | |
| Hubbard Darryl C | $198,000 | Fidelity National Title | |
| Freedman Lottie S | -- | -- |
Source: Public Records
Mortgage History
| Date | Status | Borrower | Loan Amount |
|---|---|---|---|
| Previous Owner | Hubbard Darryl C | $110,000 |
Source: Public Records
Tax History Compared to Growth
Tax History
| Year | Tax Paid | Tax Assessment Tax Assessment Total Assessment is a certain percentage of the fair market value that is determined by local assessors to be the total taxable value of land and additions on the property. | Land | Improvement |
|---|---|---|---|---|
| 2025 | $3,963 | $292,476 | $87,738 | $204,738 |
| 2023 | $3,963 | $281,121 | $84,332 | $196,789 |
| 2022 | $3,771 | $275,610 | $82,679 | $192,931 |
| 2021 | $3,682 | $270,207 | $81,058 | $189,149 |
| 2020 | $3,618 | $267,437 | $80,227 | $187,210 |
| 2019 | $3,555 | $262,194 | $78,654 | $183,540 |
| 2018 | $3,493 | $257,054 | $77,113 | $179,941 |
| 2017 | $3,446 | $252,014 | $75,601 | $176,413 |
| 2016 | $3,387 | $247,073 | $74,119 | $172,954 |
| 2015 | $3,398 | $243,363 | $73,006 | $170,357 |
| 2014 | $3,347 | $238,598 | $71,577 | $167,021 |
Source: Public Records
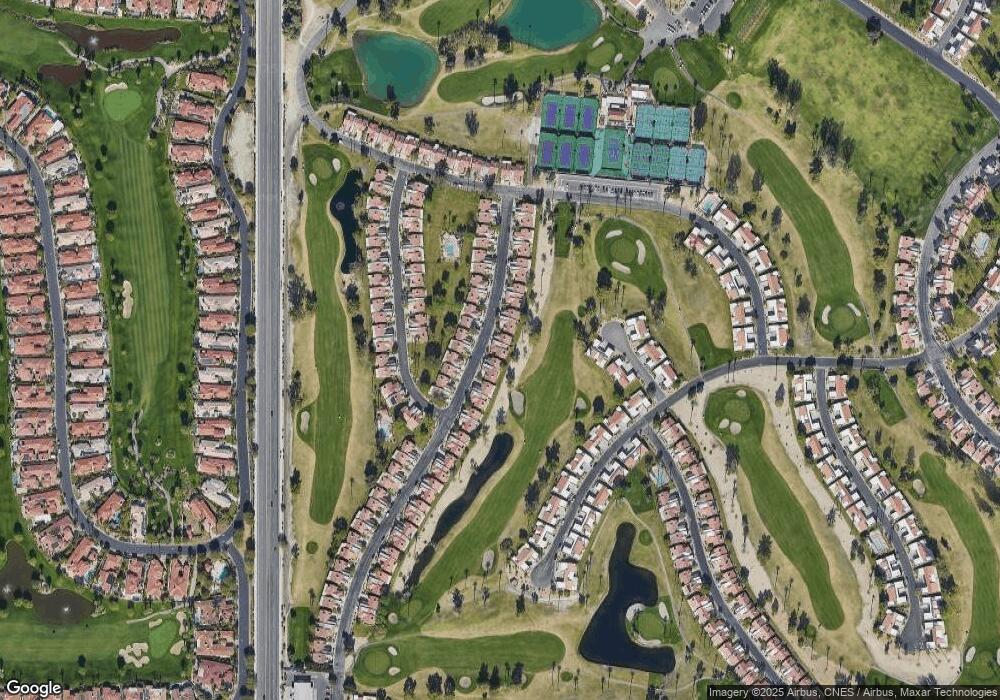
Map
Nearby Homes
- 41451 Kansas St
- 41360 Kansas St
- 41537 Princeville Ln
- 41351 Kansas St
- 41531 Peach Tree Ct
- 41387 Princeville Ln
- 41968 Preston Trail
- 41476 Inverness Way
- 41811 Kansas St
- 41934 Preston Trail
- 77178 Pauma Valley Way
- 77050 Pauma Valley Way
- 41495 Preston Trail
- 40994 Sea Island Ln
- 41806 Jupiter Hills Ct
- 945 Hawk Hill Trail
- 40997 Sea Island Ln
- 41456 Resorter Blvd
- 41550 Palmetto Ln
- 76955 Turendot St
- 41450 Kansas St
- 41440 Kansas St
- 41470 Kansas St
- 41430 Kansas St Unit 43-19
- 41430 Kansas St
- 41480 Kansas St
- 41420 Kansas St
- 41431 Kansas St
- 41500 Kansas St
- 41421 Kansas St
- 41481 Kansas St Unit 65-19
- 41481 Kansas St
- 41410 Kansas St
- 41491 Kansas St
- 41510 Kansas St Unit 37-19
- 41510 Kansas St
- 41411 Kansas St
- 41400 Kansas St
- 41511 Kansas St
- 41401 Kansas St Unit 59-19