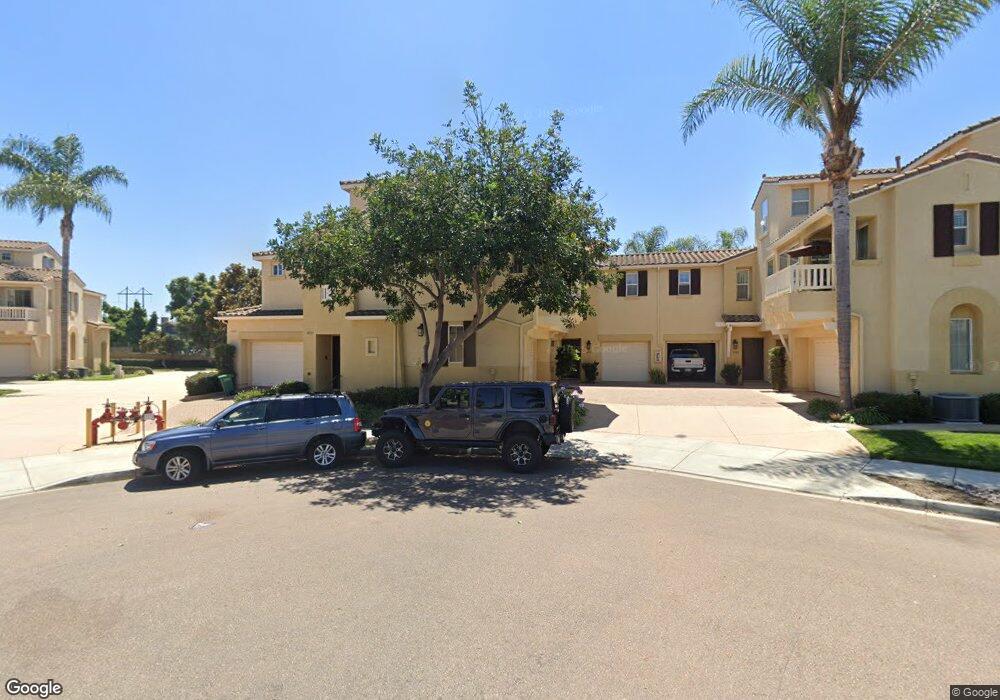
4148 Karst Rd Unit 169 Carlsbad, CA 92010
Calavera Hills NeighborhoodEstimated Value: $801,000 - $822,000
3
Beds
2
Baths
1,341
Sq Ft
$606/Sq Ft
Est. Value
About This Home
This home is located at 4148 Karst Rd Unit 169, Carlsbad, CA 92010 and is currently estimated at $812,632, approximately $605 per square foot. 4148 Karst Rd Unit 169 is a home located in San Diego County with nearby schools including Calavera Hills Elementary, Calavera Hills Middle, and Sage Creek High.
Ownership History
Date
Name
Owned For
Owner Type
Purchase Details
Closed on
Sep 18, 2015
Sold by
Rafidi Fuad and Rafidi Sawsan
Bought by
Marlinspike Llc
Current Estimated Value
Purchase Details
Closed on
Mar 5, 2013
Sold by
Rafidi Fund and Rafidi Sawsan
Bought by
Rafidi Fuad and Rafidi Sawsan
Home Financials for this Owner
Home Financials are based on the most recent Mortgage that was taken out on this home.
Original Mortgage
$308,650
Interest Rate
3.4%
Mortgage Type
New Conventional
Purchase Details
Closed on
Mar 29, 2007
Sold by
Cal E1 Llc
Bought by
Rafidi Fuad and Rafidi Sawsan
Home Financials for this Owner
Home Financials are based on the most recent Mortgage that was taken out on this home.
Original Mortgage
$41,115
Interest Rate
5.84%
Mortgage Type
Stand Alone Second
Create a Home Valuation Report for This Property
The Home Valuation Report is an in-depth analysis detailing your home's value as well as a comparison with similar homes in the area
Home Values in the Area
Average Home Value in this Area
Purchase History
| Date | Buyer | Sale Price | Title Company |
|---|---|---|---|
| Marlinspike Llc | -- | None Available | |
| Rafidi Fuad | -- | None Available | |
| Rafidi Fuad | -- | Tsi | |
| Rafidi Fuad | $411,500 | First American Title |
Source: Public Records
Mortgage History
| Date | Status | Borrower | Loan Amount |
|---|---|---|---|
| Previous Owner | Rafidi Fuad | $308,650 | |
| Previous Owner | Rafidi Fuad | $41,115 | |
| Previous Owner | Rafidi Fuad | $328,924 |
Source: Public Records
Tax History Compared to Growth
Tax History
| Year | Tax Paid | Tax Assessment Tax Assessment Total Assessment is a certain percentage of the fair market value that is determined by local assessors to be the total taxable value of land and additions on the property. | Land | Improvement |
|---|---|---|---|---|
| 2025 | $7,373 | $550,830 | $322,871 | $227,959 |
| 2024 | $7,373 | $540,031 | $316,541 | $223,490 |
| 2023 | $7,348 | $529,443 | $310,335 | $219,108 |
| 2022 | $7,257 | $519,062 | $304,250 | $214,812 |
| 2021 | $7,517 | $508,885 | $298,285 | $210,600 |
| 2020 | $7,472 | $503,668 | $295,227 | $208,441 |
| 2019 | $7,371 | $493,793 | $289,439 | $204,354 |
| 2018 | $7,149 | $484,112 | $283,764 | $200,348 |
| 2017 | $7,050 | $474,620 | $278,200 | $196,420 |
| 2016 | $6,478 | $430,000 | $250,000 | $180,000 |
| 2015 | $6,207 | $400,000 | $233,000 | $167,000 |
| 2014 | $5,841 | $365,000 | $213,000 | $152,000 |
Source: Public Records
Map
Nearby Homes
- 4682 Meadow Dr
- 2992 Lexington Cir
- 2754 Inverness Dr
- 2835 Hillsboro Ct
- 2935 Cliff Cir Unit 33
- 3545 Knollwood Dr
- 3019 Glenbrook St
- 3840 Stoneridge Rd
- 3618 Milford Place
- 2755 Victoria Ave
- 4060 Alto St
- 2543 Glasgow Dr
- 4459 Dorchester Place
- 3438 Don Alberto Dr Unit 434
- 3466 Don Lorenzo Dr Unit 324
- 3445 Don Ortega Dr
- 5115 Don Miguel Dr Unit 165
- 3462 Don Alberto Dr
- 5188 Don Rodolfo Dr
- 3514 Don Juan Dr
- 4150 Karst Rd
- 4146 Karst Rd Unit 171
- 4152 Karst Rd
- 4142 Karst Rd
- 4140 Karst Rd Unit 163
- 4154 Karst Rd Unit 166
- 4131 Karst Rd
- 4129 Karst Rd
- 4127 Karst Rd
- 4138 Karst Rd
- 4135 Karst Rd
- 4156 Karst Rd
- 4133 Karst Rd Unit 175
- 4132 Karst Rd
- 4134 Karst Rd
- 4125 Karst Rd Unit 174
- 4130 Karst Rd
- 4128 Karst Rd Unit 161
- 4126 Karst Rd Unit 160
- 4124 Karst Rd