41484 Inverness Way Unit 19-14 Palm Desert, CA 92211
Estimated Value: $319,938 - $379,000
2
Beds
2
Baths
1,065
Sq Ft
$326/Sq Ft
Est. Value
About This Home
This home is located at 41484 Inverness Way Unit 19-14, Palm Desert, CA 92211 and is currently estimated at $347,485, approximately $326 per square foot. 41484 Inverness Way Unit 19-14 is a home located in Riverside County with nearby schools including Ronald Reagan Elementary School, Colonel Mitchell Paige Middle School, and Palm Desert High School.
Ownership History
Date
Name
Owned For
Owner Type
Purchase Details
Closed on
Jul 7, 2015
Sold by
Asplund Ryan J and Asplund Jacqueline G
Bought by
Asplund Family Trust
Current Estimated Value
Purchase Details
Closed on
Nov 16, 2012
Sold by
Star Lit Llc
Bought by
Asplund Ryan J and Asplund Jacqueline G
Home Financials for this Owner
Home Financials are based on the most recent Mortgage that was taken out on this home.
Original Mortgage
$128,000
Outstanding Balance
$88,283
Interest Rate
3.35%
Mortgage Type
New Conventional
Estimated Equity
$259,202
Purchase Details
Closed on
Apr 20, 2012
Sold by
Burns Marc E
Bought by
Star Lit Llc
Purchase Details
Closed on
Jun 8, 2010
Sold by
Burns Marc E
Bought by
Burns Marc E and Gallasch Rhiannon M
Purchase Details
Closed on
Dec 5, 2003
Sold by
Burns Marc E
Bought by
Burns Marc E and Marc E Burns 2003 Trust
Purchase Details
Closed on
Feb 11, 2000
Sold by
Mozilo Mark A and Mozilo Michelle R
Bought by
Burns Marc E
Purchase Details
Closed on
Dec 10, 1999
Sold by
Whittet Richard and Whittet Kellene
Bought by
Mozilo Mark A and Mozilo Michelle R
Create a Home Valuation Report for This Property
The Home Valuation Report is an in-depth analysis detailing your home's value as well as a comparison with similar homes in the area
Home Values in the Area
Average Home Value in this Area
Purchase History
| Date | Buyer | Sale Price | Title Company |
|---|---|---|---|
| Asplund Family Trust | -- | None Available | |
| Asplund Ryan J | $160,000 | First American Title Company | |
| Star Lit Llc | -- | None Available | |
| Burns Marc E | -- | None Available | |
| Burns Marc E | -- | -- | |
| Burns Marc E | -- | Chicago Title | |
| Mozilo Mark A | -- | -- |
Source: Public Records
Mortgage History
| Date | Status | Borrower | Loan Amount |
|---|---|---|---|
| Open | Asplund Ryan J | $128,000 |
Source: Public Records
Tax History Compared to Growth
Tax History
| Year | Tax Paid | Tax Assessment Tax Assessment Total Assessment is a certain percentage of the fair market value that is determined by local assessors to be the total taxable value of land and additions on the property. | Land | Improvement |
|---|---|---|---|---|
| 2025 | $2,817 | $197,014 | $59,099 | $137,915 |
| 2023 | $2,817 | $189,365 | $56,805 | $132,560 |
| 2022 | $2,669 | $185,653 | $55,692 | $129,961 |
| 2021 | $2,602 | $182,013 | $54,600 | $127,413 |
| 2020 | $2,559 | $180,148 | $54,041 | $126,107 |
| 2019 | $2,516 | $176,617 | $52,982 | $123,635 |
| 2018 | $2,474 | $173,155 | $51,945 | $121,210 |
| 2017 | $2,448 | $169,761 | $50,927 | $118,834 |
| 2016 | $2,414 | $166,433 | $49,929 | $116,504 |
| 2015 | $2,421 | $163,935 | $49,180 | $114,755 |
| 2014 | $2,387 | $160,725 | $48,217 | $112,508 |
Source: Public Records
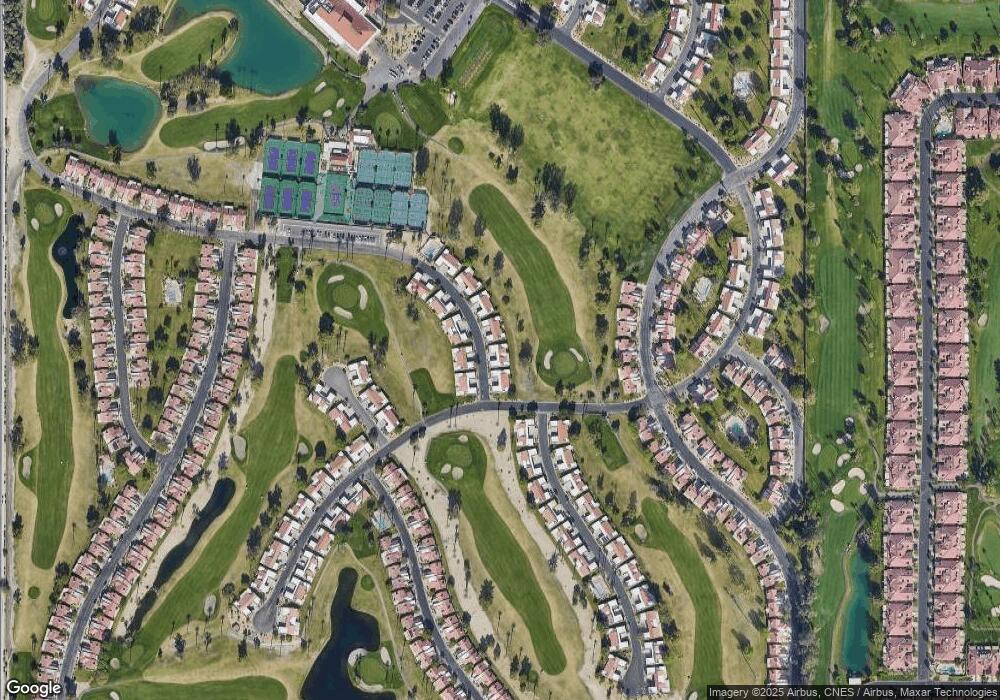
Map
Nearby Homes
- 41476 Inverness Way
- 41495 Preston Trail
- 41531 Peach Tree Ct
- 41479 Resorter Blvd
- 41968 Preston Trail
- 41360 Kansas St
- 41456 Resorter Blvd
- 41550 Palmetto Ln
- 41806 Jupiter Hills Ct
- 41351 Kansas St
- 41451 Kansas St
- 41934 Preston Trail
- 41537 Princeville Ln
- 41387 Princeville Ln
- 41525 Woodhaven Dr W
- 41410 Woodhaven Dr W Unit 715
- 77178 Pauma Valley Way
- 41823 Preston Trail
- 40884 La Costa Cir E
- 40789 La Costa Cir E
- 41484 Inverness Way
- 41488 Inverness Way Unit 20-14
- 41488 Inverness Way
- 41480 Inverness Way
- 41494 Inverness Way
- 41476 Inverness Way Unit 17-14
- 41483 Inverness Way
- 41487 Inverness Way
- 41483 Inverness #04-14 Way
- 41498 Inverness Way
- 41470 Inverness Way Unit 16-14
- 41470 Inverness Way
- 41493 Inverness Way
- 41471 Inverness Way Unit 6-14
- 41471 Inverness Way
- 41497 Inverness Way
- 41641 Inverness Way
- 41466 Inverness Way
- 41461 Inverness Way
- 41460 Inverness Way