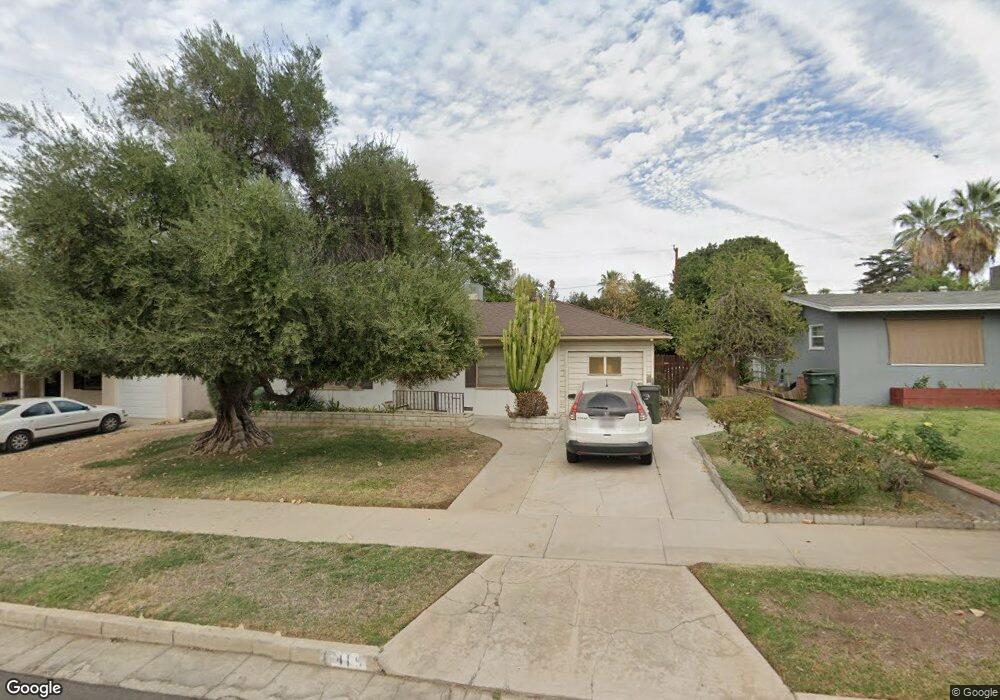
415 Bond St Redlands, CA 92373
South Redlands NeighborhoodEstimated Value: $556,000 - $631,000
2
Beds
1
Bath
1,379
Sq Ft
$431/Sq Ft
Est. Value
About This Home
This home is located at 415 Bond St, Redlands, CA 92373 and is currently estimated at $593,924, approximately $430 per square foot. 415 Bond St is a home located in San Bernardino County with nearby schools including Smiley Elementary School, Cope Middle School, and Redlands Senior High School.
Ownership History
Date
Name
Owned For
Owner Type
Purchase Details
Closed on
Sep 22, 2022
Sold by
Carrillo Diane M
Bought by
Diane M Carrillo Trust
Current Estimated Value
Purchase Details
Closed on
Aug 25, 2004
Sold by
Steele Carol R
Bought by
Carrillo Diane M
Home Financials for this Owner
Home Financials are based on the most recent Mortgage that was taken out on this home.
Original Mortgage
$280,451
Interest Rate
5.8%
Mortgage Type
New Conventional
Create a Home Valuation Report for This Property
The Home Valuation Report is an in-depth analysis detailing your home's value as well as a comparison with similar homes in the area
Home Values in the Area
Average Home Value in this Area
Purchase History
| Date | Buyer | Sale Price | Title Company |
|---|---|---|---|
| Diane M Carrillo Trust | -- | -- | |
| Carrillo Diane M | $289,500 | Chicago Title Company |
Source: Public Records
Mortgage History
| Date | Status | Borrower | Loan Amount |
|---|---|---|---|
| Previous Owner | Carrillo Diane M | $280,451 |
Source: Public Records
Tax History Compared to Growth
Tax History
| Year | Tax Paid | Tax Assessment Tax Assessment Total Assessment is a certain percentage of the fair market value that is determined by local assessors to be the total taxable value of land and additions on the property. | Land | Improvement |
|---|---|---|---|---|
| 2025 | $4,605 | $403,018 | $100,754 | $302,264 |
| 2024 | $4,605 | $395,115 | $98,778 | $296,337 |
| 2023 | $4,598 | $387,367 | $96,841 | $290,526 |
| 2022 | $4,530 | $379,771 | $94,942 | $284,829 |
| 2021 | $4,611 | $372,324 | $93,080 | $279,244 |
| 2020 | $4,541 | $368,507 | $92,126 | $276,381 |
| 2019 | $4,412 | $361,282 | $90,320 | $270,962 |
| 2018 | $4,301 | $354,198 | $88,549 | $265,649 |
| 2017 | $4,263 | $347,253 | $86,813 | $260,440 |
| 2016 | $4,075 | $329,400 | $99,400 | $230,000 |
| 2015 | $3,799 | $305,000 | $92,000 | $213,000 |
| 2014 | $3,804 | $305,000 | $92,000 | $213,000 |
Source: Public Records
Map
Nearby Homes
- 521 Bond St
- 628 W Fern Ave
- 622 Esther Way
- 1044 W Cypress Ave
- 1110 W Cypress Ave
- 230 S Buena Vista St
- 636 Harding Dr
- 527 W Palm Ave
- 9440 Hollie Dr
- 24 S Ash St
- 108 S Buena Vista St
- 350 Sherwood St
- 305 W Olive Ave
- 101 W Fern Ave
- 133 S San Mateo St
- 975 Brookside Ave
- 527 Nottingham Dr
- 1239 Fulbright Ave
- 24 Grant St
- 120 W Olive Ave