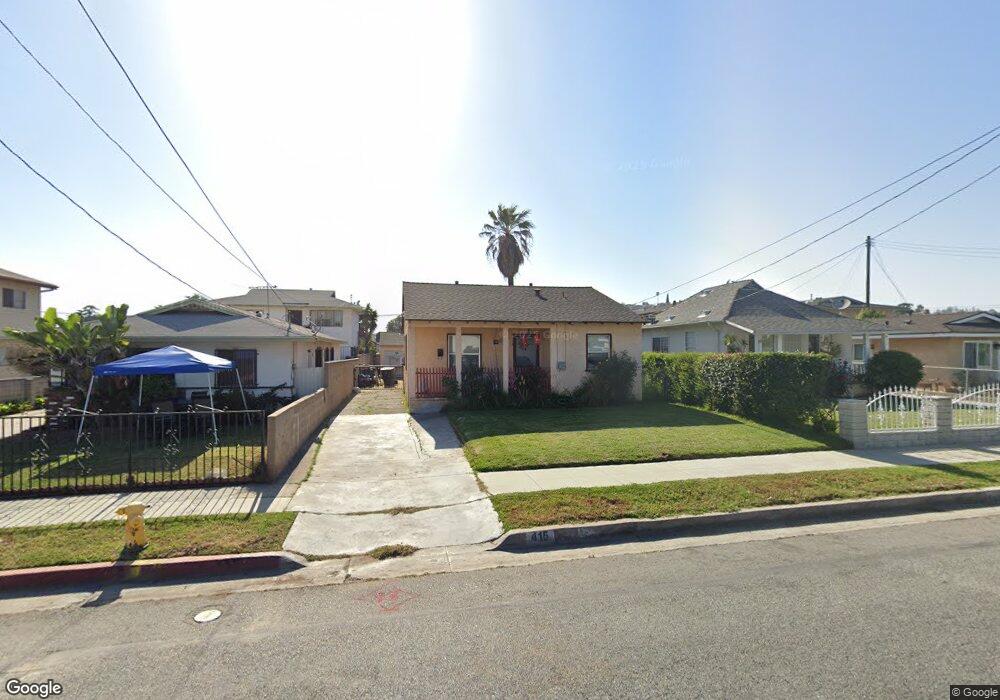
415 Elm St Alhambra, CA 91801
Dolgeville NeighborhoodEstimated Value: $700,952 - $938,000
2
Beds
1
Bath
754
Sq Ft
$1,075/Sq Ft
Est. Value
About This Home
This home is located at 415 Elm St, Alhambra, CA 91801 and is currently estimated at $810,738, approximately $1,075 per square foot. 415 Elm St is a home located in Los Angeles County with nearby schools including Emery Park Elementary School, Alhambra High School, and Oneonta Montessori School.
Ownership History
Date
Name
Owned For
Owner Type
Purchase Details
Closed on
Jul 5, 2001
Sold by
Miranda Victor Guzman and Miranda Maria Delrefugio
Bought by
Ly Hoa Thi Huong
Current Estimated Value
Home Financials for this Owner
Home Financials are based on the most recent Mortgage that was taken out on this home.
Original Mortgage
$164,900
Outstanding Balance
$63,363
Interest Rate
7.1%
Mortgage Type
Stand Alone Second
Estimated Equity
$747,375
Purchase Details
Closed on
Nov 9, 1999
Sold by
Chlavin Myron Z and Chlavin Myron Z
Bought by
Miranda Victor Guzman
Home Financials for this Owner
Home Financials are based on the most recent Mortgage that was taken out on this home.
Original Mortgage
$142,025
Interest Rate
7.84%
Purchase Details
Closed on
Mar 31, 1995
Sold by
Chlavin Myron Z and Desser Nettie
Bought by
Desser Nettie
Purchase Details
Closed on
Aug 15, 1991
Sold by
Chlavin Myron Z and Desser Nettie
Bought by
Chlavin Myron Z and The Myron Z Chlavin & Nettie Desser Tr
Create a Home Valuation Report for This Property
The Home Valuation Report is an in-depth analysis detailing your home's value as well as a comparison with similar homes in the area
Home Values in the Area
Average Home Value in this Area
Purchase History
| Date | Buyer | Sale Price | Title Company |
|---|---|---|---|
| Ly Hoa Thi Huong | $170,000 | Stewart Title | |
| Miranda Victor Guzman | $149,500 | Commonwealth Land Title Co | |
| Desser Nettie | -- | -- | |
| Desser Nettie | -- | -- | |
| Chlavin Myron Z | -- | -- |
Source: Public Records
Mortgage History
| Date | Status | Borrower | Loan Amount |
|---|---|---|---|
| Open | Ly Hoa Thi Huong | $164,900 | |
| Previous Owner | Miranda Victor Guzman | $142,025 | |
| Closed | Ly Hoa Thi Huong | $4,600 |
Source: Public Records
Tax History Compared to Growth
Tax History
| Year | Tax Paid | Tax Assessment Tax Assessment Total Assessment is a certain percentage of the fair market value that is determined by local assessors to be the total taxable value of land and additions on the property. | Land | Improvement |
|---|---|---|---|---|
| 2025 | $3,228 | $251,121 | $200,906 | $50,215 |
| 2024 | $3,228 | $246,198 | $196,967 | $49,231 |
| 2023 | $3,225 | $241,371 | $193,105 | $48,266 |
| 2022 | $3,079 | $236,639 | $189,319 | $47,320 |
| 2021 | $3,047 | $232,000 | $185,607 | $46,393 |
| 2019 | $2,944 | $225,120 | $180,102 | $45,018 |
| 2018 | $2,898 | $220,707 | $176,571 | $44,136 |
| 2016 | $2,672 | $212,138 | $169,715 | $42,423 |
| 2015 | $2,632 | $208,952 | $167,166 | $41,786 |
| 2014 | $2,604 | $204,860 | $163,892 | $40,968 |
Source: Public Records
Map
Nearby Homes
- 601 Orange Grove Ave
- 657 S Meridian Ave
- 2400 W Main St
- 2115 Vine St
- 1900 Pepper St Unit 12
- 2620 W Grand Ave Unit E
- 2616 W Grand Ave Unit C
- 1901 Vine St Unit 1
- 208 La France Ave
- 3949 Stockbridge Ave
- 125 N Bushnell Ave
- 4211 Lowell Ave
- 1005 Westmont Dr
- 22 N Electric Ave
- 5390 Huntington Dr S
- 111 N Marguerita Ave
- 1100 S Ethel Ave
- 1412 Larch St
- 2901 Front St
- 5350 Oakland St